
NUC Small Form Factor Chia Plotting Build
Rev 1.1 (updated for Chia version 1.0.4 with reduced temp space!!)
“We have Amazon affiliate links in this article and we earn commission from qualifying purchases at zero cost to you. We only recommend products that we use ourselves and would never compromise the integrity of your build. This helps us bring you quality content and keep this site running.”
Ask @storage_jm on keybase for any questions regarding this build
This plotting build is a small form factor Intel NUC, that has a 6 core 10th gen Intel i7, a 2TB NVMe, and a SATA boot drive in one easy-to-build small desktop. NUC contains a small 4in x 4in motherboard. This is a perfect build for a novice and requires NO previous PC building experience, and the entire build can be completed in under 15 minutes. The total price is $850 and can plot around 1.8TB a day.
Here is the updated test from 1.0.4, after plotting 73 consecutive plots the system is averaging 1.61TiB or 1.77TB per day!
grep -i "total time" /home/jm/chialogs/*.log |awk '{sum=sum+$4} {avg=sum/NR} {tday=86400/avg*6*101.366/1024} END {printf "%d K32 plots, avg %0.1f seconds, %0.2f TiB/day \n", NR, avg, tday}'

73 K32 plots, avg 31804.9 seconds, 1.61 TiB/day or 1.77TB per day
Sorry for the crappy audio in the beginning and the 5 min editing job. Skip ahead if you are just looking for the install. My wife said to me when she saw this, “What is this, Ryan’s world? why are you filming your unboxing?”
Budget for NUC build
| Component | Model | Price | Comment |
| CPU, motherboard, PSU and case | Intel BXNUC10i7FNH | $590 | Core of the build, 6 core i7-10710U built in! make sure you find the one that does not already include DRAM and SSD |
| DRAM | 32GB DDR4 2666 or higher, need SO DIMM (laptop memory) | $120 | I used this Crucial |
| Boot SSD | 480GB SATA SSD | $50 | Cheapest boot option, whatever you have available works, this one can fit another plot on it |
| Temp SSD | 2TB NVMe M.2 80mm | $220 | I selected this Inland due to 3200TBW endurance. NUC does not have lots of room for M.2 with heatsink, but I’m told the Seagate Firecuda 520 also fits (3600TBW) |
| Total | $980 |
CPU Selection
This build circles around the critical component the i7-10710U, integrated 6 core CPU that boosts up to 4.7GHz. This is a great mobile and low power CPU, especially for the price. It is also very power efficient.
DRAM
Since this build revolves around doing 5-6 k=32 in parallel, 32GB of DDR4 is the target in 2x16GB DIMMs. My advice is to find the cheapest DRAM you can possibly find. There is likely some benefit to faster DDR4 speeds, around 3200 to 3600MHz, but it hasn’t been widely demonstrated in the reference plotting hardware as of today. Make sure you order SO-DIMM, this is the small laptop style memory required for the NUC.
Power Supply Unit (PSU)
Built into the NUC!
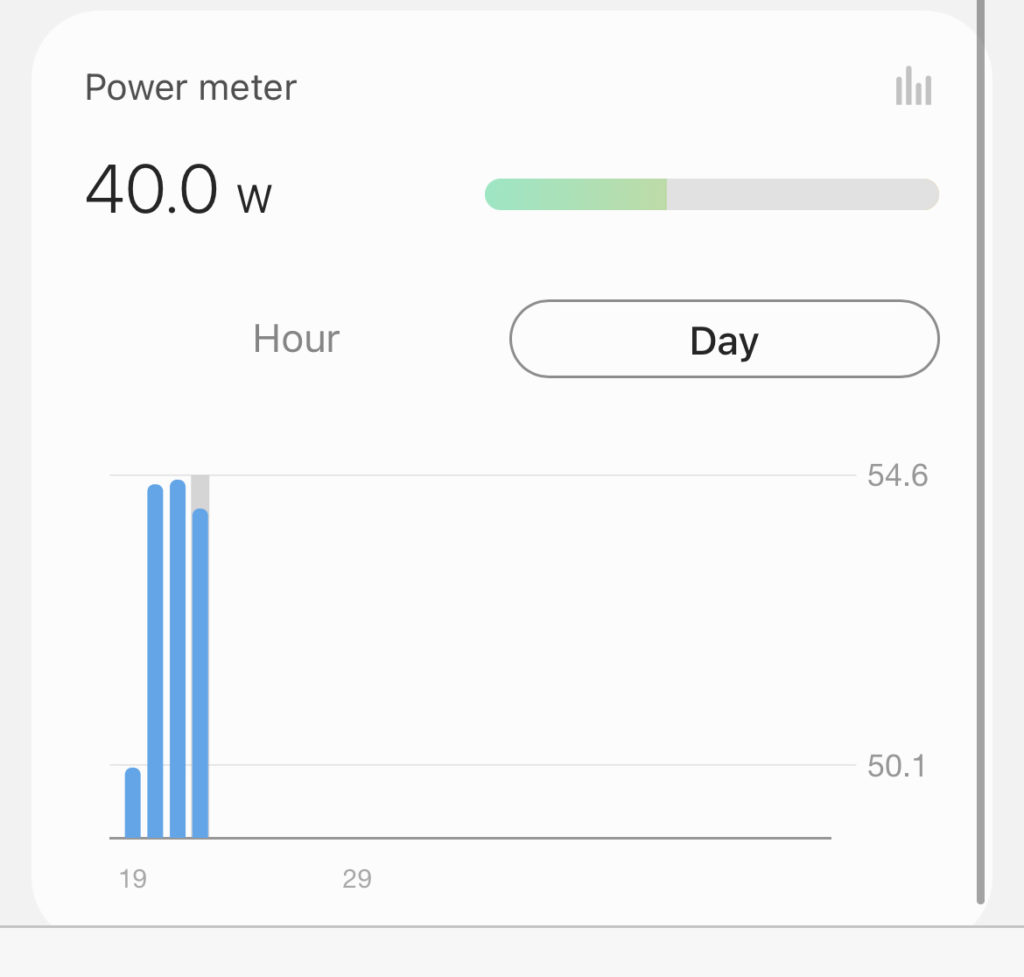
I measured the power with my Samsung smart things monitor, and the NUC consumed an average of 54.6W of power over 2 days of plotting. This is a very power efficient plotting computer.
Motherboard
Built into the NUC!
SSD for temporary storage
This build will be targeting 5-6 plots in parallel, and requires ~332GiB per process for a total temporary space requirement of 1660GiB or 1.78TB.
- 1x 1920GB SATA
- Preference of Intel S4510, S4610, or Samsung or Micron datacenter – target sub $200 on eBay used
- 1x 2TB NVMe M.2 80mm
- This is the most common M.2 form factor for SSDs. Unfortunately, the NUC does not support 110mm M.2 so data center class NVMe cannot be used
- Find an M.2 on the endurance spreadsheet with high TBW. Consumer NVMe models vary greatly in sustained performance, I suggest doing some research on sustained IO performance in review sites like Toms Hardware, Anandtech, and StorageReview
- Inland Premium (beware, NOT the Inland platinum), Seagate Firecuda 520. Corsair MP600 USA version (heatsink too big though, if you want to mod). Any M.2 80mm with low profile heat sink with good sustained write performance and 3600TBW endurance is the target for this build, as it will be running all day every day.
Thermals for temp drives. NVMe SSDs get hot with sustained write workloads. Monitor temps through smartmontools (sudo smartctl -a /dev/nvme0n1) or NVMe-CLI (sudo nvme smart-log /dev/nvme0n1). If your NVMe drive is getting above 70C and triggering the NVMe SMART critical temp warning, crank the fan speed up to max in the BIOS.
Destination drive
This case requires both drives, one for boot and one for temp storage. You “could” boot off a USB stick and use a 2.5in SSD or HDD for -d, but I would recommend just putting the destination drives on a network target. Synology is a great NAS for beginners. USB attach destination drive is also totally fine, just make sure it does not go to sleep so disable all power settings.
BIOS update
Visit the NUC website on Intel.com here and click on “Drivers and Software” and “Download BIOS”. This step is optional but generally good practice to always update the BIOS on new hardware. In this case, I am not installing Windows so the easiest way to update the BIOS is to download the .CAP file. Copy the file to a small USB key that is formatted to FAT32. When you boot the NUC, hit F7 to enter the BIOS update screen, and select the .CAP file. This process takes around 5 minutes, so sit back and grab some coffee.
Time to plot!
There is almost no need for any major tuning, the out of the box performance should be around 2TB per day, depending on the temporary storage that was chosen.
- Complete NUC build – this took me a total of 5 minutes (most of time finding the screw driver for the stupid M.2 screw)
- Find a USB stick that we will use for the OS install
- Install Ubuntu Server – no need for a monitor with this besides initial install. Ubuntu desktop is tempting…but you need to install a lot more packages and there are many more chances for bugs. Take the training wheels off and try cli only!
- After getting the iso file for Ubuntu Server – If you’re on a mac use Balena Etcher, if you’re on Windows use Rufus. If you’re on Linux then you don’t need this advice (but here it is anyways)
- ssh into from your laptop (open terminal on mac, or powershell in Windows)
ssh user@hostname (or ip address)- Make sure your HDD appears and format destination drive (only if you are doing the USB boot and local destination drive)
sudo fdisk -l
sudo mkfs.ext4 -m 0 -T largefile4 -L <drivename> /dev/sda
This is the optimal setting for destination drive to maximize storage capacity efficiency with a very short format time
sudo mkdir /mnt/hdd
sudo mount /dev/sda /mnt/hdd- format temp drive
sudo mkfs.xfs /dev/nvme0n1
sudo mkdir /mnt/ssd
sudo mount -t xfs -o discard /dev/nvme0n1 /mnt/ssdmkdir ~/chialogs- edit permissions (I know, I know, this isn’t best security practice but this should be on your home network NOT in a remote location. Different security is required if this is the case)
sudo chmod 777 /mnt/hdd
sudo chmod 777 /mnt/ssd
chmod 777 ~/chialogs
sudo nano chia6.sh- Paste the follow in, with edits to your user name, and temp and destination directory names. Save by hitting Ctrl + O and exit with Ctrl + X
#!/bin/bash
screen -d -m -S chia1 bash -c 'cd /home/user/chia-blockchain && . ./activate && sleep 0h && chia plots create -k 32 -b 4000 -r 4 -u 128 -n 16 -t /mnt/ssd/temp1 -2 /mnt/ssd -d /mnt/hdd |tee /home/user/chialogs/chia1_1_.log'
screen -d -m -S chia2 bash -c 'cd /home/user/chia-blockchain && . ./activate && sleep 1h && chia plots create -k 32 -b 4000 -r 4 -u 128 -n 16 -t /mnt/ssd/temp2 -2 /mnt/ssd -d /mnt/hdd |tee /home/user/chialogs/chia2_1_.log'
screen -d -m -S chia3 bash -c 'cd /home/user/chia-blockchain && . ./activate && sleep 2h && chia plots create -k 32 -b 4000 -r 4 -u 128 -n 16 -t /mnt/ssd/temp3 -2 /mnt/ssd -d /mnt/hdd |tee /home/user/chialogs/chia3_1_.log'
screen -d -m -S chia4 bash -c 'cd /home/user/chia-blockchain && . ./activate && sleep 3h && chia plots create -k 32 -b 4000 -r 4 -u 128 -n 16 -t /mnt/ssd/temp4 -2 /mnt/ssd -d /mnt/hdd |tee /home/user/chialogs/chia4_1_.log'
screen -d -m -S chia5 bash -c 'cd /home/user/chia-blockchain && . ./activate && sleep 4h && chia plots create -k 32 -b 4000 -r 4 -u 128 -n 16 -t /mnt/ssd/temp5 -2 /mnt/ssd -d /mnt/hdd |tee /home/user/chialogs/chia5_1_.log'
screen -d -m -S chia6 bash -c 'cd /home/user/chia-blockchain && . ./activate && sleep 6h && chia plots create -k 32 -b 4000 -r 4 -u 128 -n 16 -t /mnt/ssd/temp6 -2 /mnt/ssd -d /mnt/hdd |tee /home/user/chialogs/chia6_1_.log'
Set n value to total number of k=32 plots per your capacity drive on the optimal size spreadsheet here divided by 5. You can also use the tool from user @kiwihaitch called https://plot-plan.chia.foxypool.io/ that finds the optimal configuration for maximum capacity utilization. This build revolves around 5-6 k=32, which is fine for the overwhelming majority of users. If you want to get over 99% capacity utilization on the destination drives, you need to use a mix of some k=33 and k=34 (completely optional!!)
Run script! sh chia6.sh
After running make sure there are no permissions errors and that the script started correctly by monitoring the processes through htop or something similar. Everything runs in screens in the background, so you are perfectly fine to shut down the ssh from your laptop and let this thing run as long as it takes the fill up the destination drive
Monitoring tools to use
sudo apt install nvme-cli dstat sysstat glances smartmontools lm-sensorsif you’re on Ubuntu server you should already have htop, xfs, and mdadm. If you are on Ubuntu desktop you will need these too.
sudo apt install htop xfsprogs mdadmdstat, iostat, glances – use this to make sure drives are doing io. You can monitor things like IOPS, bandwidth, and iowait to ensure everything is running optimally
$ dstat
You did not select any stats, using -cdngy by default.
--total-cpu-usage-- -dsk/total- -net/total- ---paging-- ---system--
usr sys idl wai stl| read  writ| recv  send|  in   out | int   csw
46   3  45   6   0| 456M  493M|   0     0 | 774k  873k|  14k   22k
61   4  27   8   0| 879M  135M| 382B  904B| 112k  424k|  19k   11k
66   2  30   2   0| 214M  382M| 186B  366B|  24k  340k|  10k 3228
65   3  29   4   0| 483M  220M| 126B  366B|   0   804k|  13k 6226
57   5  31   7   0| 735M  534M| 234B  358B|  48k  524k|  20k   13k
52   4  40   5   0| 608M  314M|  66B  366B|  44k   80k|  15k 7278
41   3  49   6   0| 720M  106M| 420B  408B| 104k 1068k|  15k 7554
44   2  49   5   0| 564M  123M| 126B  408B| 720k   44k|  12k 6401
htop – use to monitor cpu and memory utilization

nvme or smartctl – use to monitor temps of SSDs (temperature and Warning Temperature Time) and endurance (percentage used)
$ sudo nvme smart-log  /dev/nvme0n1
Smart Log for NVME device:nvme0n1 namespace-id:ffffffff
critical_warning                    : 0
temperature                         : 62 C
available_spare                     : 100%
available_spare_threshold           : 5%
percentage_used                     : 0%
data_units_read                     : 28,561,818
data_units_written                  : 30,698,144
host_read_commands                  : 74,551,774
host_write_commands                 : 24,076,840
controller_busy_time                : 472
power_cycles                        : 6
power_on_hours                      : 27
unsafe_shutdowns                    : 4
media_errors                        : 0
num_err_log_entries                 : 4
Warning Temperature Time            : 0
Critical Composite Temperature Time : 0
Thermal Management T1 Trans Count   : 0
Thermal Management T2 Trans Count   : 0
Thermal Management T1 Total Time    : 0
Thermal Management T2 Total Time    : 0
Checking CPU temperature
$ sensors
coretemp-isa-0000
Adapter: ISA adapter
Package id 0:  +85.0°C  (high = +100.0°C, crit = +100.0°C)
Core 0:        +84.0°C  (high = +100.0°C, crit = +100.0°C)
Core 1:        +83.0°C  (high = +100.0°C, crit = +100.0°C)
Core 2:        +75.0°C  (high = +100.0°C, crit = +100.0°C)
Core 3:        +72.0°C  (high = +100.0°C, crit = +100.0°C)
Core 4:        +82.0°C  (high = +100.0°C, crit = +100.0°C)
Core 5:        +85.0°C  (high = +100.0°C, crit = +100.0°C)
And CPU frequency
$ cat /proc/cpuinfo | grep MHz
cpu MHz		: 3993.359
cpu MHz		: 3966.237
cpu MHz		: 3907.672
cpu MHz		: 3948.530
cpu MHz		: 3901.620
cpu MHz		: 3991.337
cpu MHz		: 3988.415
cpu MHz		: 3996.797
cpu MHz		: 3977.432
cpu MHz		: 3951.101
cpu MHz		: 3996.898
cpu MHz		: 3972.351
Alternatively you can use sudo apt install cpufrequtils
This has some more functionality but is completely optional…the built in tools work just fine cpufreq-info -f
You can also use CPU freq utils to change the clock speed. There are some good guides in this NUC review, but the simple command to ensure all clocks are running as fast as possible during turbo is
for Y in {0..11}; do cpufreq-set -c $Y -d 4.7GHz; doneChecking output TiB / TB per day
@ericaltendorf on Keybase has made plotman, a tool for automating plotting. This can also be used in this build to automate the process (TBD add config.yaml instructions in here)
There is a useful tool called analyze, which parses the folder of logfiles for total plot times.
$ python3 plotman.py analyze ~/chialogs/chia*
+-----+--------------+--------------+---------------+-------------+--------------+
| Key |   phase 1    |   phase 2    |    phase 3    |   phase 4   |  total time  |
+=====+==============+==============+===============+=============+==============+
| x   | μ=10.8K σ=2K | μ=6.9K σ=469 | μ=12.7K σ=308 | μ=1.4K σ=80 | μ=31.7K σ=2K |
+-----+--------------+--------------+---------------+-------------+--------------+
This is my average after a day of plotting on a new build with the exact script posted above. At ~8.5 hrs per K=32 plot while running 5 in parallel, this machine is currently outputting 1.35TiB/day or 1.48TB per day. Adding a 6th plot on the boot drive could likely increase this to ~1.8TB per day…will follow up with additional tweaking!
Follow up, April 17, 2021 – indeed, adding the 6th plot nicely speeds things up! welcome improvements from the Chia team in 1.0.4/1.0.5
grep -i "total time" /home/jm/chialogs/*.log |awk '{sum=sum+$4} {avg=sum/NR} {tday=86400/avg*6*101.366/1024} END {printf "%d K32 plots, avg %0.1f seconds, %0.2f TiB/day \n", NR, avg, tday}'
73 K32 plots, avg 31804.9 seconds, 1.61 TiB/day
You can also check the output manually from the logs we are collecting
$ cat ~/chialogs/chia* | grep "Total time"
Total time = 27309.978 seconds. CPU (110.610%) Wed Mar 10 23:31:07 2021
Total time = 32200.796 seconds. CPU (112.350%) Thu Mar 11 08:45:57 2021
Total time = 29839.122 seconds. CPU (110.030%) Thu Mar 11 01:13:17 2021
Total time = 32510.230 seconds. CPU (113.870%) Thu Mar 11 10:33:09 2021
Total time = 31800.602 seconds. CPU (110.830%) Thu Mar 11 02:45:58 2021
Total time = 33025.269 seconds. CPU (113.730%) Thu Mar 11 12:14:17 2021
Total time = 32825.408 seconds. CPU (110.250%) Thu Mar 11 04:03:03 2021
Total time = 32883.979 seconds. CPU (113.570%) Thu Mar 11 13:28:46 2021
Total time = 32652.323 seconds. CPU (110.500%) Thu Mar 11 05:00:10 2021
Total time = 32005.791 seconds. CPU (114.020%) Thu Mar 11 14:11:11 2021


I’m very thankful
Thank you for this
hi mate, let me start with a you sirs are a legend!!! this guide is amazing. My setup is Ryzen 5600, 32Gb of 3200 ram, 2tb NVME and usb boot pen.
Questions
1) Because I have Ryzen AMD 5600 with only 12 threads, guessing I need to hack the script to from 3 to 2 threads
2) Do I need to clean out folders between runs mnt/ssd and temp1 temp2 temp3 and so on?
3) Just so you know I mounted destination as synology. Also doing the farming in docker pom the same NAS.
yep, just 6 is probably good for 5600, but you can test up to 8 if you have enough DRAM and monitor output
you only need to manually delete temp files between run IF A PROCESS FAILS. otherwise, the plotting process deletes all the temp files for you
Synology is great, about the most power-efficient farmer that you can run
me again last silly question, it appears that I have to re-issue
sudo mount -t xfs -o discard /dev/nvme0n1 /mnt/ssd
everytime I reboot, how do io make this permanent? sudo nano /etc/fstab and enter what?
/dev/nvme0n1 /mnt/ssd xfs ??????????
Once again thanks for your help
welcome to the world of the filesystem tab! you can find your UUID for your system by doing
sudo blkid /dev/nvme0n1
then show your current filesystem tab by doing
cat /etc/fstab
and then you can add an entry by
nano /etc/fstab
and enter in
/dev/disk/by-uuid/whatevercameoutofblkid /mnt/ssd xfs discard,defaults 0 0
ctrl o then ctrl x
cheers!
JM
I followed the instruction step by step, and for now I already complete the online purchase!
I think I’m badly in need of a tutorial starting from the OS installation…is there any warmed heart community where I can get some help?
last question of the day
screen -d -m -S chia2 bash -c ‘cd /home/user/chia-blockchain && . ./activate && sleep 1h && chia plots create -k 32 -b 4000 -e -r 3 -u 128 -n 16 -t /mnt/ssd/temp2 -2 /mnt/ssd -d /mnt/hdd |tee /home/user/chialogs/chia2_1_.log’
what does the -r 3 bit do?
https://github.com/Chia-Network/chia-blockchain/wiki/CLI-Commands-Reference
-r sets number of threads
ok why do we set 3 x 5 when the processor only has 12 threads? Is there some good reason behind this I am not seeing or missing. my Ryzen 5600x with 2TB NVME 32GB etc is only doing about 6 every 24 using this script and I think I am missing something.
I understand now
rather that the script do 6 plots each delayed by 1 hour.
It is do 6 plots in parallel repeated 16 times with 1 hours delay to stagger them. How did I get that so wrong :-) getting 12 to 13 plots an hour and could increase it to 7 in parallel but think 5 will do. Now to repeat the build X 2.
Next build I am going to use a PCI-E NVME adaptor from ebay x 2 so I get 4 x 500Gb NVMEs and 4 x 500Gb 2.5 HDD should be able to reach 20 plots per pay this way.
Once again thanks for the super guide.
Thank you for this guide! I just finished setting this up and I am very happy with it already. I’ve been looking for a small computer for some time and this simplifies plotting greatly.
Stupid question:
Is the farming also directly happening with this setup and on this machine? Can I run the farming with only ubuntu server?
After plots are created, how to start farming on those plots ? Can I continue creating plots using that shell script and run full node to those created plots on same machine at same time ?
Could you recommend any good resources for troubleshooting setups and scripts like these? Or for getting a better grasp of these commands in general?
I’m a good example of the novice you reference. The build was simple enough, I have Ubuntu server running, and I’m able to ssh in from my laptop. I was also able to stumble through the cli commands, but when I run the script and check htop, it doesn’t appear chia is running like it is in your guide. Is there a good way to detect where I went wrong?
don’t feel bad, even I screw up stupid permissions on Linux all the time. I’ll see if I can record a video of a new setup and slow down a little bit :)
all the isuses I’ve helped people debug are mount issues (because the way I did it was trying to be easy, but not persistent across power cycles) or permissions issues (chmod 777 /mnt/x and ls -lh /mnt to make sure all mounts have write access)
Thank you! Your permissions tip helped me sort out some issues I had on that front. In the end, it seems my main problem was with the keys. I followed the ‘no key’ route above, but the script wouldn’t do anything until I generated new keys. Appears to be working great now.
when i am running “sh chia5.sh” I get:
chia5.sh: 2: screen: not found
chia5.sh: 3: screen: not found
chia5.sh: 4: screen: not found
chia5.sh: 5: screen: not found
chia5.sh: 6: screen: not found
what does it mean?
That means you don’t have screen installed, use
‘sudo apt get install screen’
To install it
I set up two of these NUCs with same exact hardware as you recommend above.
One of them is running great. The other refuses to plot at a decent rate. I’ve tried only running two K-32s and they are averaging about 29 hours each. Using 4,000 RAM max, 3 threads, and disabled bitfield. I’ve tried reformatting the SSD and HDD multiple times. I see the CPU is hardly being used in the monitor tool.
Any suggestions?
I’ve gotten myself 2 nucs as well. They’re plotting extermely slow(one machine has done 40000s, and the other hasn’t even finished a plot), and I’m seeing very low utilization of threads. and the SSD temps are around 65C as well.
Is the context swapping with linux not that great and have I allocated too many threads by allocating 4 threads?
Thanks so much for putting on the time!
Very clear directions that even newbs like me can use.
I sounds like a jet engine any fix to that :-)
I could imagine it’s because of the 100% of processing usage. Once plotting is done it should go down i think
My Swap is 100% is that normal?
Thank you for putting this gem of a guide together! I am working on collecting my parts. Quick Question: Why is a 480GB Boot SSD specified in the budget table & shown in the title picture, but under SSD for Temporary Usage heading a 1920GB SATA is referenced? Is this a mistype? Is there an advantage to sizing up to 1920GB SATA?
Thanks!
Any chance you can share some of the tweaks and if you ever got it to output 1.8 TB? :)