
Overview
I use Ubuntu server for running Chia on all of my farmers and harvesters, and I don’t have a need or desire to run the Chia GUI. A dashboard can help you see the status and health of your farm at a glance. My go-to combination for monitoring general system information, like CPU usage, disk stats, temperature, and power, is node-exporter and Prometheus. The Chia dashboard uses a combination of chia-exporter, which will export data to Prometheus. If all of this is confusing, don’t worry, we will have some basic things you can copy and paste to get to work. Linux is great because there are a million ways to do everything, but in this case with Prometheus, finding information online about how to run was very challenging for me when I was just getting started in Linux.
Tools
- Chia Exporter – this comes directly from Chia, so no 3rd party monitoring scripts are required
- Node Exporter – this is what we will use for a general dashboard for monitoring
- Prometheus – the database / data source where this is all stored so you can see the stats over time
- Grafana – this is for hosting the dashboards
- Docker – this makes running the above extremely easy, and is my preferred method
Monitoring
Node-exporter will be used to monitor CPU utilization, disk io and latency, system power, temperatures, and much more.
Chia-exporter will monitor the full node to ensure it is synced, with things like Netspace and block validation time, mempool fees, and more information about the full node. The wallet can monitor the balance of multiple wallets. The harvester and farmer section can monitor the number of plots, harvester latency (which is critical for farming and even more for compressed plots), and plots passing the filter.
Installation
Install Chia-Exporter
https://github.com/Chia-Network/chia-exporter
Copy paste these into your Ubuntu command line
sudo apt-get update
sudo apt-get install ca-certificates curl gnupg
curl -sL https://repo.chia.net/FD39E6D3.pubkey.asc | sudo gpg --dearmor -o /usr/share/keyrings/chia.gpg
echo "deb [arch=$(dpkg --print-architecture) signed-by=/usr/share/keyrings/chia.gpg] https://repo.chia.net/chia-exporter/debian/ stable main" | sudo tee /etc/apt/sources.list.d/chia-exporter.list > /dev/null
sudo apt-get update
sudo apt-get install chia-exporter
We are going to create a basic service so it will start automatically (change your user)
sudo nano /etc/systemd/system/chia-exporter.service[Unit]
Description=Chia Exporter Service
[Service]
Type=simple
ExecStart=/usr/local/bin/chia-exporter serve
User=jm
Group=jm
[Install]
WantedBy=multi-user.targetNow hit CTRL+O to save, then CTRL-X to exit nano
sudo systemctl daemon-reload
sudo systemctl enable chia-exporter.service
sudo systemctl start chia-exporter.service
sudo systemctl status chia-exporter.service
You are now running Chia Exporter! You will need this running on all your farmers and harvester.
Install Docker
You can either install docker through snap, apt or the method I use is directly from Docker for Ubuntu
https://docs.docker.com/engine/install/ubuntu/
# Add Docker's official GPG key:
sudo apt-get update
sudo apt-get install ca-certificates curl gnupg
sudo install -m 0755 -d /etc/apt/keyrings
curl -fsSL https://download.docker.com/linux/ubuntu/gpg | sudo gpg --dearmor -o /etc/apt/keyrings/docker.gpg
sudo chmod a+r /etc/apt/keyrings/docker.gpg

# Add the repository to Apt sources:
echo \
  "deb [arch=$(dpkg --print-architecture) signed-by=/etc/apt/keyrings/docker.gpg] https://download.docker.com/linux/ubuntu \
  $(. /etc/os-release && echo "$VERSION_CODENAME") stable" | \
  sudo tee /etc/apt/sources.list.d/docker.list > /dev/null
sudo apt-get update
sudo apt-get install docker-ce docker-ce-cli containerd.io docker-buildx-plugin docker-compose-plugin
sudo usermod -aG docker $USER
Exit your ssh, and enter back in for the user permissions to take effect
Create compose.yml and prometheus.yml
Next we are going create the compose.yml for docker, and prometheus.yml
nano compose.ymlversion: '3.8'
services:
node-exporter:
image: prom/node-exporter:latest
container_name: node-exporter
restart: unless-stopped
ports:
- 9100:9100
volumes:
- /proc:/host/proc:ro
- /sys:/host/sys:ro
- /:/rootfs:ro
command:
- "--path.procfs=/host/proc"
- "--path.sysfs=/host/sys"
- "--path.rootfs=/rootfs"
- "--collector.filesystem.ignored-mount-points='^/(sys|proc|dev|host|etc|rootfs/var/lib/docker/containers|rootfs/var/lib/docker/overlay2|rootfs/run/docker/netns|rootfs/var/lib/docker/aufs)($$|/)'"
prometheus:
image: prom/prometheus:latest
container_name: prometheus
restart: unless-stopped
volumes:
- ./prometheus.yml:/etc/prometheus/prometheus.yml
- prometheus_storage:/prometheus
command:
- '--config.file=/etc/prometheus/prometheus.yml'
ports:
- 9090:9090
grafana:
image: grafana/grafana-oss:latest
container_name: grafana
restart: unless-stopped
ports:
- 3000:3000
volumes:
- grafana_storage:/var/lib/grafana
volumes:
prometheus_storage:
grafana_storage:Now hit CTRL+O to save, then CTRL-X to exit nano
nano prometheus.ymlglobal:
scrape_interval: 15s
scrape_configs:
- job_name: "prometheus"
scrape_interval: 15s
static_configs:
- targets: ["localhost:9090"]
- job_name: "node"
static_configs:
- targets: ["node-exporter:9100"]
- job_name: "chia-exporter"
static_configs:
- targets: ["192.168.0.101:9914"]
labels:
application: 'chia-blockchain'
network: 'mainnet'Starting everything up
Run your compose file
docker compose up -d
Log into Grafana
Open a browser
navigate to IP address:3000, e.g. 192.168.0.101:3000

Default name and password are
admin admin
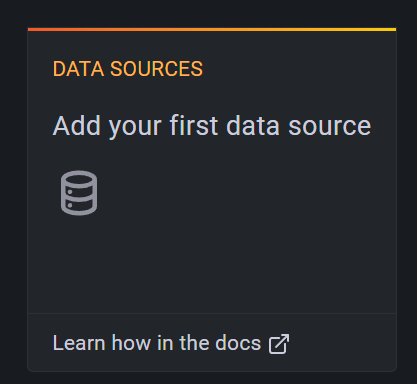
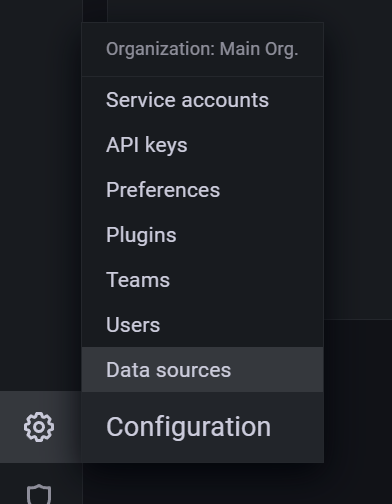
Click on add data source
Click on prometheus
Add the url
http://192.168.0.101:9090
(your IP address of the system you are running Prometheus on)

Then click save and test
add dashboard

Type in 1860 (which is node exporter)
Select Prometheus data source
Ensure that is all working

Add new dashboard for Chia Farming, exactly like above
https://grafana.com/orgs/chianetwork/dashboards
import number 17939
Win! You now have a serious hardcore farming dashboard


Hi JM, thanks for taking the time to write this up. However I get a lot of “no data” fields in my grafana dashboard, despite following all your steps.
My setup is 4 machines, all Ubuntu:
– full node (with GUI) running chia-blockchain_1.7.1rc2-dev26-6a966913_amd64.deb – to support compressed plots as I’m just replotting
– 3 harvesters (just CLI) running the same version as CLI
– all computers on the same LAN
– all keys copied, harvesters have been working with farmer/full node for nearly 2 years without problems.
My problem is that I’m a little new to grafana and prometheus and I appreciate you don’t have time to help me troubleshoot, but how can I best debug? i.e. are there any log files I can review to understand why I have all these “no data” fields?
Ya that is generally the wrong ip in the Prometheus.yml. Datasource came up green after clicking test? You can always hit me up on Keybase at @storage_jm for help
I’m not understanding why docker is involved. Can’t this be done locally on the farmer?
is there a tutorial where everything is installed on the 1 and only farmer? (no harvesters)
you can certainly run prometheus, node-exporter, grafana, and chia-exporter without docker – but docker is much easier and the intended way to run this stack