
Fill a 14TB hard drive per day! Chia Plotting on the beast
AMD Threadripper and Intel Optane PCIe 4.0, Using MadMAx and plotman to automate
One of the community members who I have spent a decent amount of time chatting with over the past few months asked me if I knew anyone who wanted to buy some of his plotting equipment. I’ve been wanting to test out a Threadripper system for a while, so I caved and sent him some Chia in exchange for, what he refers to as, “beast”. Beast is an AMD Threadripper 3970X with 128GB of DDR4.
I’m also testing out using plotman with madMAx plotter. This was a lot of fun. I have a 5800X system I use for my gaming desktop, but 99% of the desktops I’ve owned are Intel based. I’m having fun poking at AMD and seeing what all the hype about Threadripper is.
The system setup
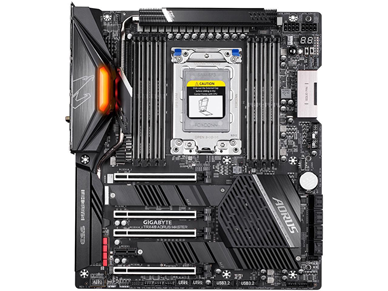
Motherboard
Gigabyte Technology Co., Ltd. TRX40 AORUS MASTER
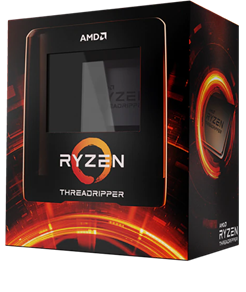
CPU
AMD Ryzen Threadripper 3970X 32-Core Processor
DRAM
128GB of DDR4 3600, 4 units of 32GB (F4-3600C18-32GVK)

SSD
Intel Optane SSD DC P5800X, 800GB


Inland 1TB Premium +
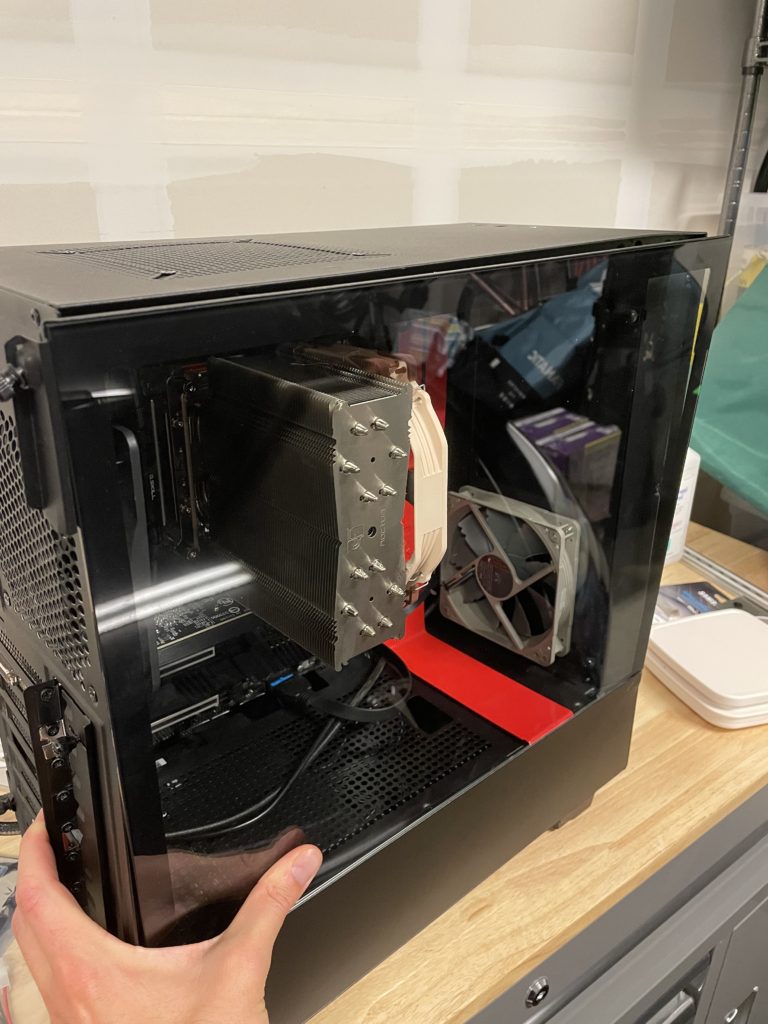
Case
A broken NZXT H510 (thanks FedEx!)
Get system prepared
BIOS Update
Fun! Gigabytes site is broken and won’t let me download the latest, so I guess I’m staying on FBh.

Turn on XMP

Go to AMD Overclocking

Input target of 4300MHz and 1350mV

Install Ubuntu Server 21.04, USB created with rufus
I had to install Zenpower to get temperatures to show up correctly in lm-sensors
zenpower-pci-00c3
Adapter: PCI adapter
SVI2_Core:     1.32 V
SVI2_SoC:      1.07 V
Tdie:         +61.2°C  (high = +95.0°C)
Tctl:         +61.2°C
Tccd1:        +58.0°C
Tccd3:        +60.2°C
Tccd5:        +57.2°C
Tccd7:        +61.2°C
SVI2_P_Core:  71.26 W
SVI2_P_SoC:   37.44 W
SVI2_C_Core:  54.02 A
SVI2_C_SoC:   35.02 A
sudo apt install nvme-cli lm-sensors dstat sysstatsudo apt-get update
sudo apt-get upgrade -y
# Install Git
sudo apt install git -y
# Checkout the source and install
git clone https://github.com/Chia-Network/chia-blockchain.git -b latest --recurse-submodules
cd chia-blockchain
sh install.sh
. ./activateWhile activated
Install Plotman
pip install --force-reinstall git+https://github.com/ericaltendorf/plotman@mainGenerate config
plotman config generateChange config to your settings
nano ~/.config/plotman/plotman.yaml

version: [2]
logging:
        plots: /home/jm/chialogs
user_interface:
        use_stty_size: True
commands:
        interactive:
                autostart_plotting: True
                autostart_archiving: False
directories:
        tmp:
                - /mnt/5800X
#uncomment this if you are only doing a single drive with ramdrive as tmp2
        #tmp2: /mnt/ram
        dst:
                - /mnt/5510
scheduling:
        tmpdir_stagger_phase_major: 2
        tmpdir_stagger_phase_minor: 0
        tmpdir_stagger_phase_limit: 1
        tmpdir_max_jobs: 2
        global_max_jobs: 2
        global_stagger_m: 0
        polling_time_s: 20
plotting:
        farmer_pk: <insert your farmer pk here>
        pool_contract_address: <insert your pool contract address from chia plot nft show>
        type: madmax
        chia:
                k: 32                # k-size of plot, leave at 32 most of the time
                e: False             # Use -e plotting option
                n_threads: 2         # Threads per job
                n_buckets: 128       # Number of buckets to split data into
                job_buffer: 3389     # Per job memory
        madmax:
                executable: /home/jm/chia-plotter/build/chia_plot
                n_threads: 32          # Default is 4, crank up if you have many cores
                n_buckets: 512        # Default is 256
Install madMAx
sudo apt install -y libsodium-dev cmake g++ git build-essential
# Checkout the source and install
git clone https://github.com/madMAx43v3r/chia-plotter.git
cd chia-plotter

git submodule update --init
./make_devel.sh
Format and mount your drives
An actual NVMe format is a secure erase, this will put the drive at the fresh out of box state (where the firmware isn’t tracking any user data). This is better than just formatting and getting discards, and usually much faster.
sudo nvme list

sudo nvme format /dev/nvme0n1
sudo mkfs.xfs /dev/nvme0n1
sudo mkdir /mnt/5800X
sudo mount -o discard /dev/nvme0n1 /mnt/5800X

sudo nvme format /dev/nvme1n1
sudo mkfs.xfs /dev/nvme1n1
sudo mkdir /mnt/5510
sudo mount -o discard /dev/nvme1n1 /mnt/5510
Start a screen
screen -S plot
cd chia-blockchain; . ./activate; plotman interactive
Checking total outputcat ~/chialogs/*.log | grep Total
cat ~/chialogs/*.log | grep Total

Total plot creation time was 1252.41 sec (20.8736 min)
Total plot creation time was 1346.65 sec (22.4442 min)
Total plot creation time was 1333.39 sec (22.2231 min)
Total plot creation time was 1363.55 sec (22.7258 min)
Total plot creation time was 1348.44 sec (22.474 min)
Total plot creation time was 1358.26 sec (22.6376 min)
Total plot creation time was 1341.31 sec (22.3551 min)
Total plot creation time was 1361.2 sec (22.6867 min)
Total plot creation time was 981.74 sec (16.3623 min)
grep -i "total plot creation time" ~/chialogs/*.log |awk '{sum=sum+$6} {avg=sum/NR} {tday=86400/avg*2*101.366/1024} END {printf "%d K32 plots, avg %0.1f seconds, %0.2f TiB/day \n", NR, avg, tday}'
5 K32 plots, avg 1354.6 seconds, 12.63 TiB/dayRemember after the avg to put the number of parallel plots you are running!
Value
As is with the Optane SSD, this system is around $5k. I bought everything besides the SSD used for $3k. I think this entire system can be bought and hit similar performance for under $3500. The CPU will be a high-end option for many years, so I think it will retain its value fairly well. This system can be repurposed for a video editing machine, workstation, or development platform when it is done with Chia plotting. I haven’t figured out what exactly I’ll be doing with it, but I’m having a lot of fun using it for Chia drive and plotting benchmarking at the moment!
What about other SSD options? What about using ramdisk with madMAx?
You don’t need 128GB of DDR4 on this system if you are going to use the Optane or high-performance PCIe 4.0 SSD for the temp. If you are doing this, 32 or 64GB is more than enough for this build. I happen to already have it in this system, so I’ll do a short test of this system with ramdisk and a cheap SSD, the Inland Premium.
sudo mount -t tmpfs -o size=110G tmpfs /mnt/ram/

jm@beast:~$ cat ~/chialogs/*.log | grep Total
Total plot creation time was 868.818 sec (14.4803 min)
Total plot creation time was 868.969 sec (14.4828 min)
Total plot creation time was 889.433 sec (14.8239 min)
Total plot creation time was 869.849 sec (14.4975 min)

jm@beast:~$ grep -i "total plot creation time" ~/chialogs/*.log |awk '{sum=sum+$6} {avg=sum/NR} {tday=86400/avg*1*101.366/1024} END {printf "%d K32 plots, avg %0.1f seconds, %0.2f TiB/day \n", NR, avg, tday}'
4 K32 plots, avg 874.3 seconds, 9.78 TiB/day
Not bad! So for 75% reduced SSD wear and a cheap SSD, this system can do 10TiB a day at $2500-3000.
There are still old servers that beat this value…but remember when it comes time to resell your plotting equipment selling a nice high-end desktop is much easier than an old server (saying this as a guy who owns a whole lot of old servers)
Update 1! (that was fast), maxing out CPU utilization and trying more parallel plots in madMAx
I decided while I have both SSDs installed I would try plotman running r 16 (threads) and 2 processes to each of the SSDs. I was able to squeeze another 1TiB per day out of the system! This time around I installed Grafana and node exporter (which I will do a follow-up video on) for you to look at the output.
updated the plotman.yaml for dual directories
nano ~/.config/plotman/plotman.yaml

version: [2]
logging:
        plots: /home/jm/chialogs
user_interface:
        use_stty_size: True
commands:
        interactive:
                autostart_plotting: True
                autostart_archiving: False
directories:
        tmp:
                - /mnt/5800X
                - /mnt/5510
        dst:
                - /mnt/dst
scheduling:
        tmpdir_stagger_phase_major: 2
        tmpdir_stagger_phase_minor: 0
        tmpdir_stagger_phase_limit: 1
        tmpdir_max_jobs: 2
        global_max_jobs: 4
        global_stagger_m: 0
        polling_time_s: 20
plotting:
        farmer_pk: <insert your farmer pk here>
        pool_contract_address: <insert your pool contract address from chia plot nft show>
        type: madmax
        chia:
                k: 32                # k-size of plot, leave at 32 most of the time
                e: False             # Use -e plotting option
                n_threads: 2         # Threads per job
                n_buckets: 128       # Number of buckets to split data into
                job_buffer: 3389     # Per job memory
        madmax:
                executable: /home/jm/chia-plotter/build/chia_plot
                n_threads: 16          # Default is 4, crank up if you have many cores
                n_buckets: 256        # Default is 256
I kick off the plotman interactive in the screen like before, and let it run for 3 hours or so
The CPU utilization is a tad bit higher than before. This is the goal of plotting, you ideally want CPU utilization near 100%, with no iowait time and no memory bandwidth bottlenecks. If you do this, you will have the highest output of plots per day on a given system.
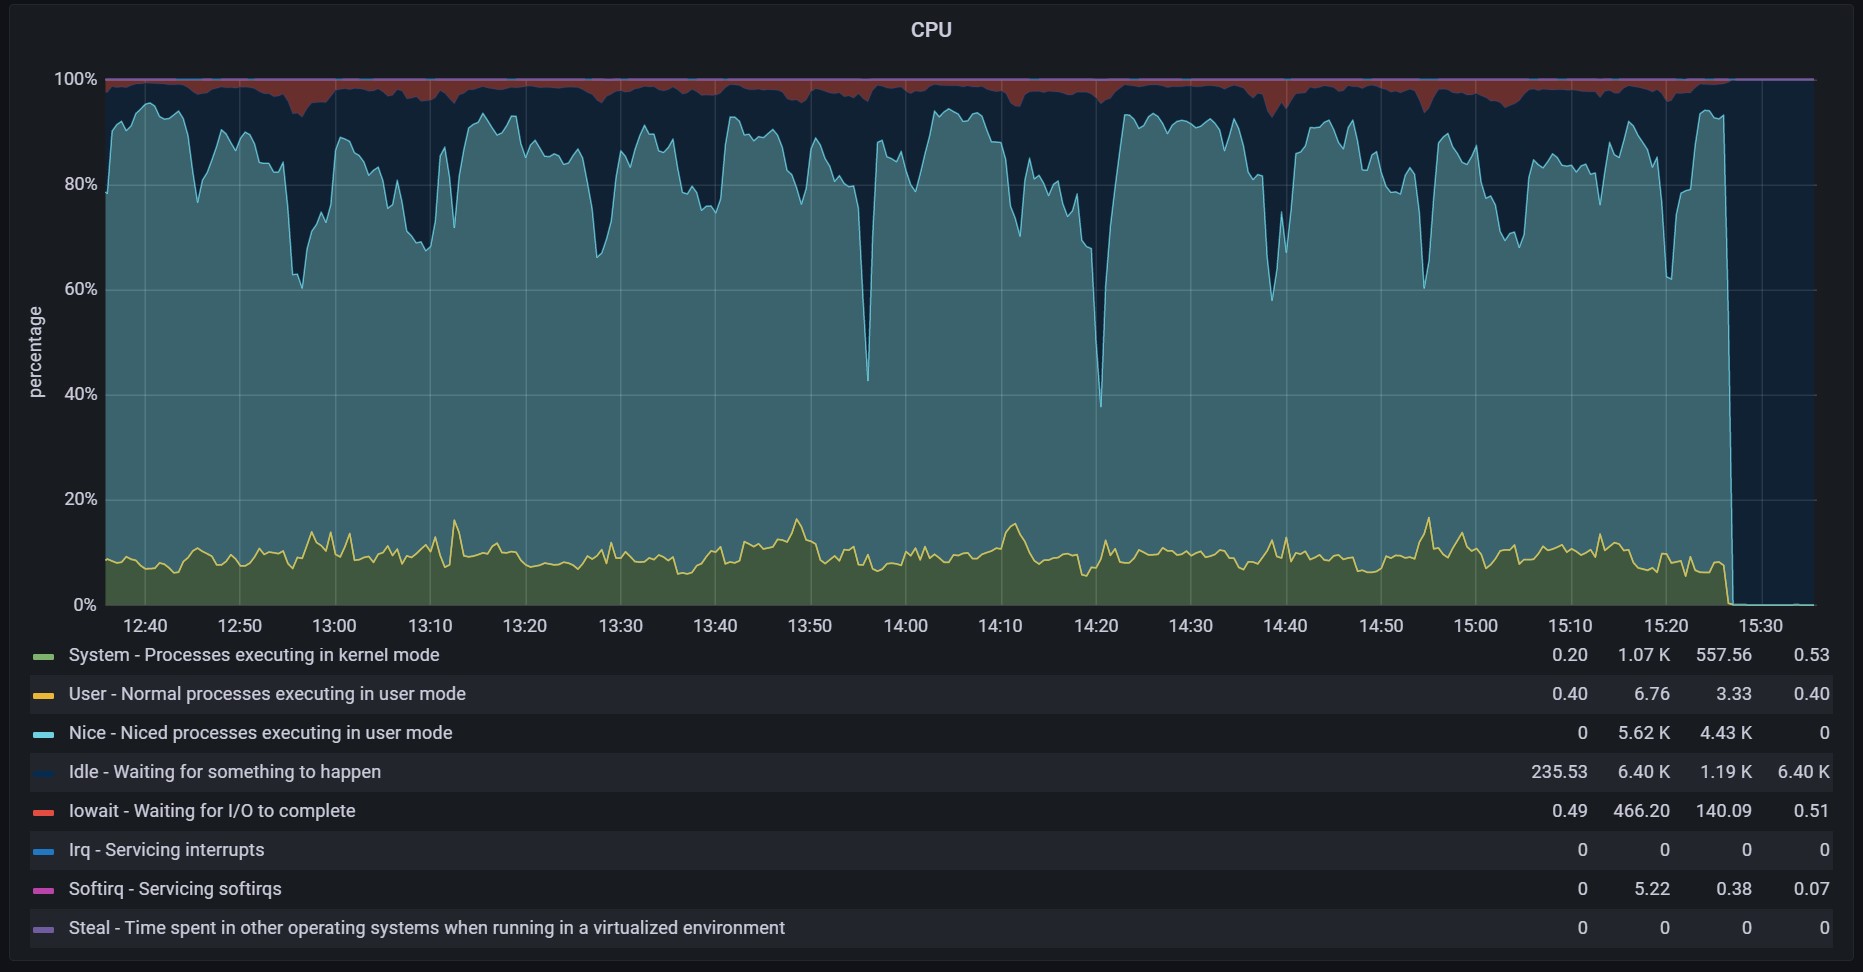
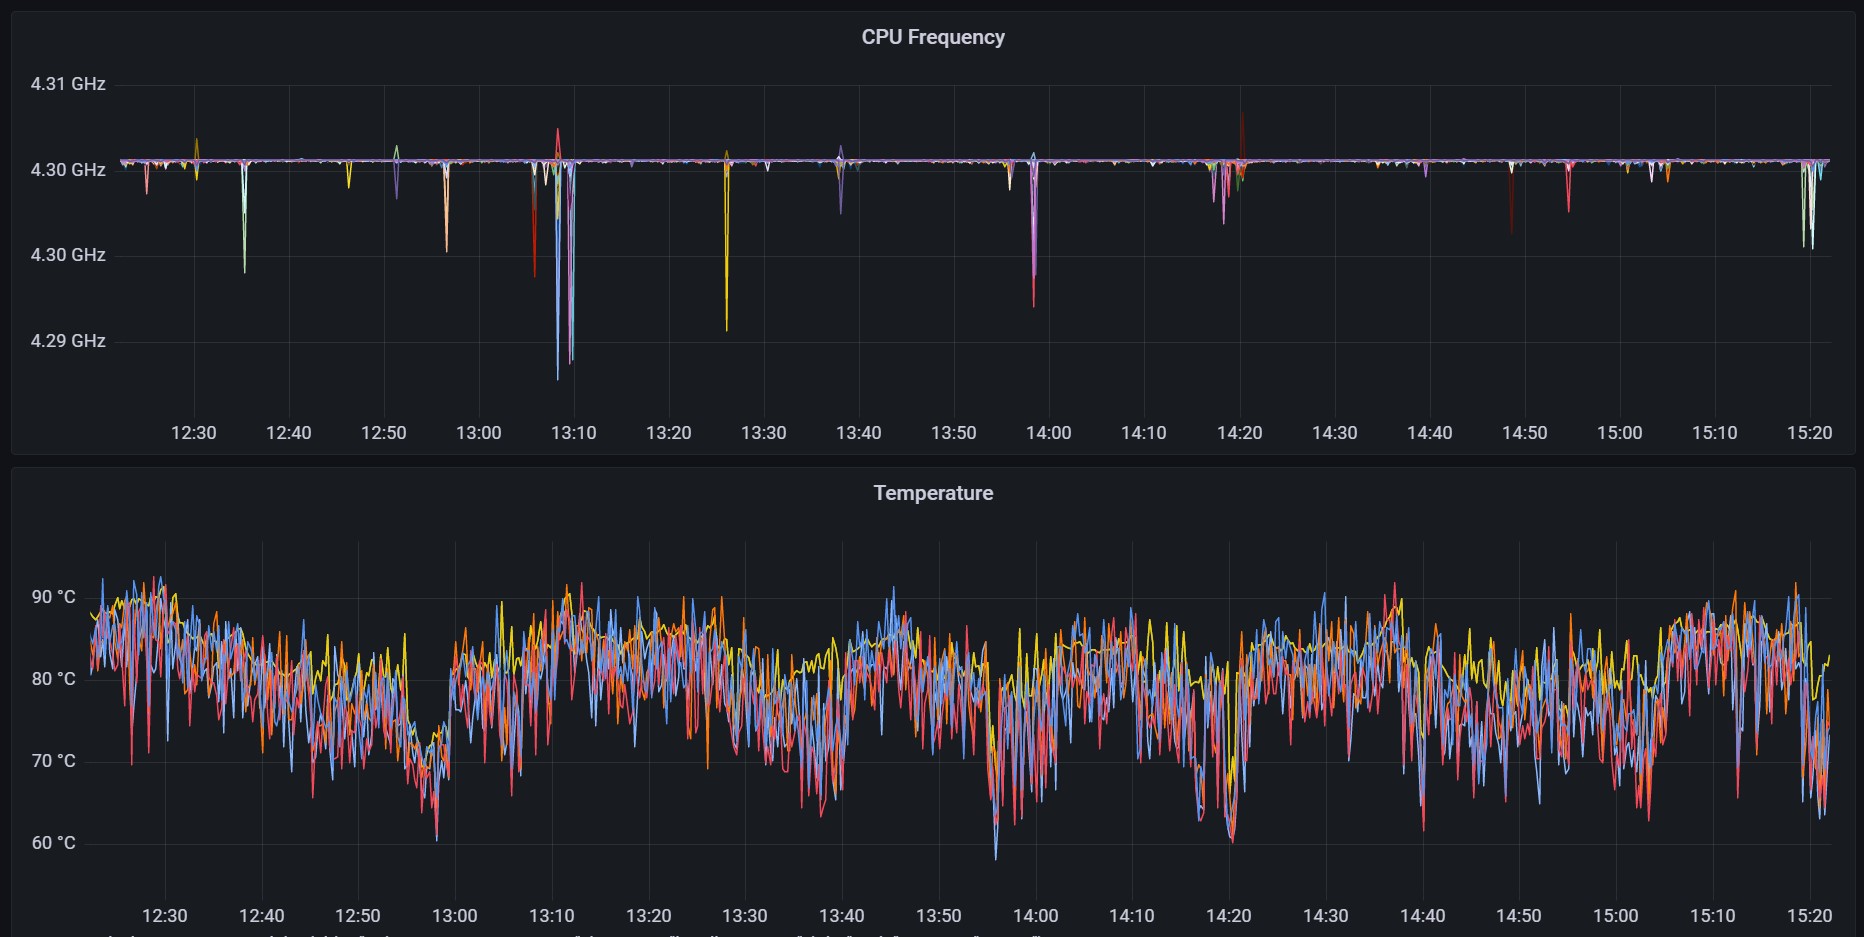
The temperatures are borderline concerning, I really don’t like to see temps above 90 degrees C. If I was running this for a sustained amount of time I would make sure these are looking a little better. I’m seeing the cores stable at 4.3GHz per my overclock!
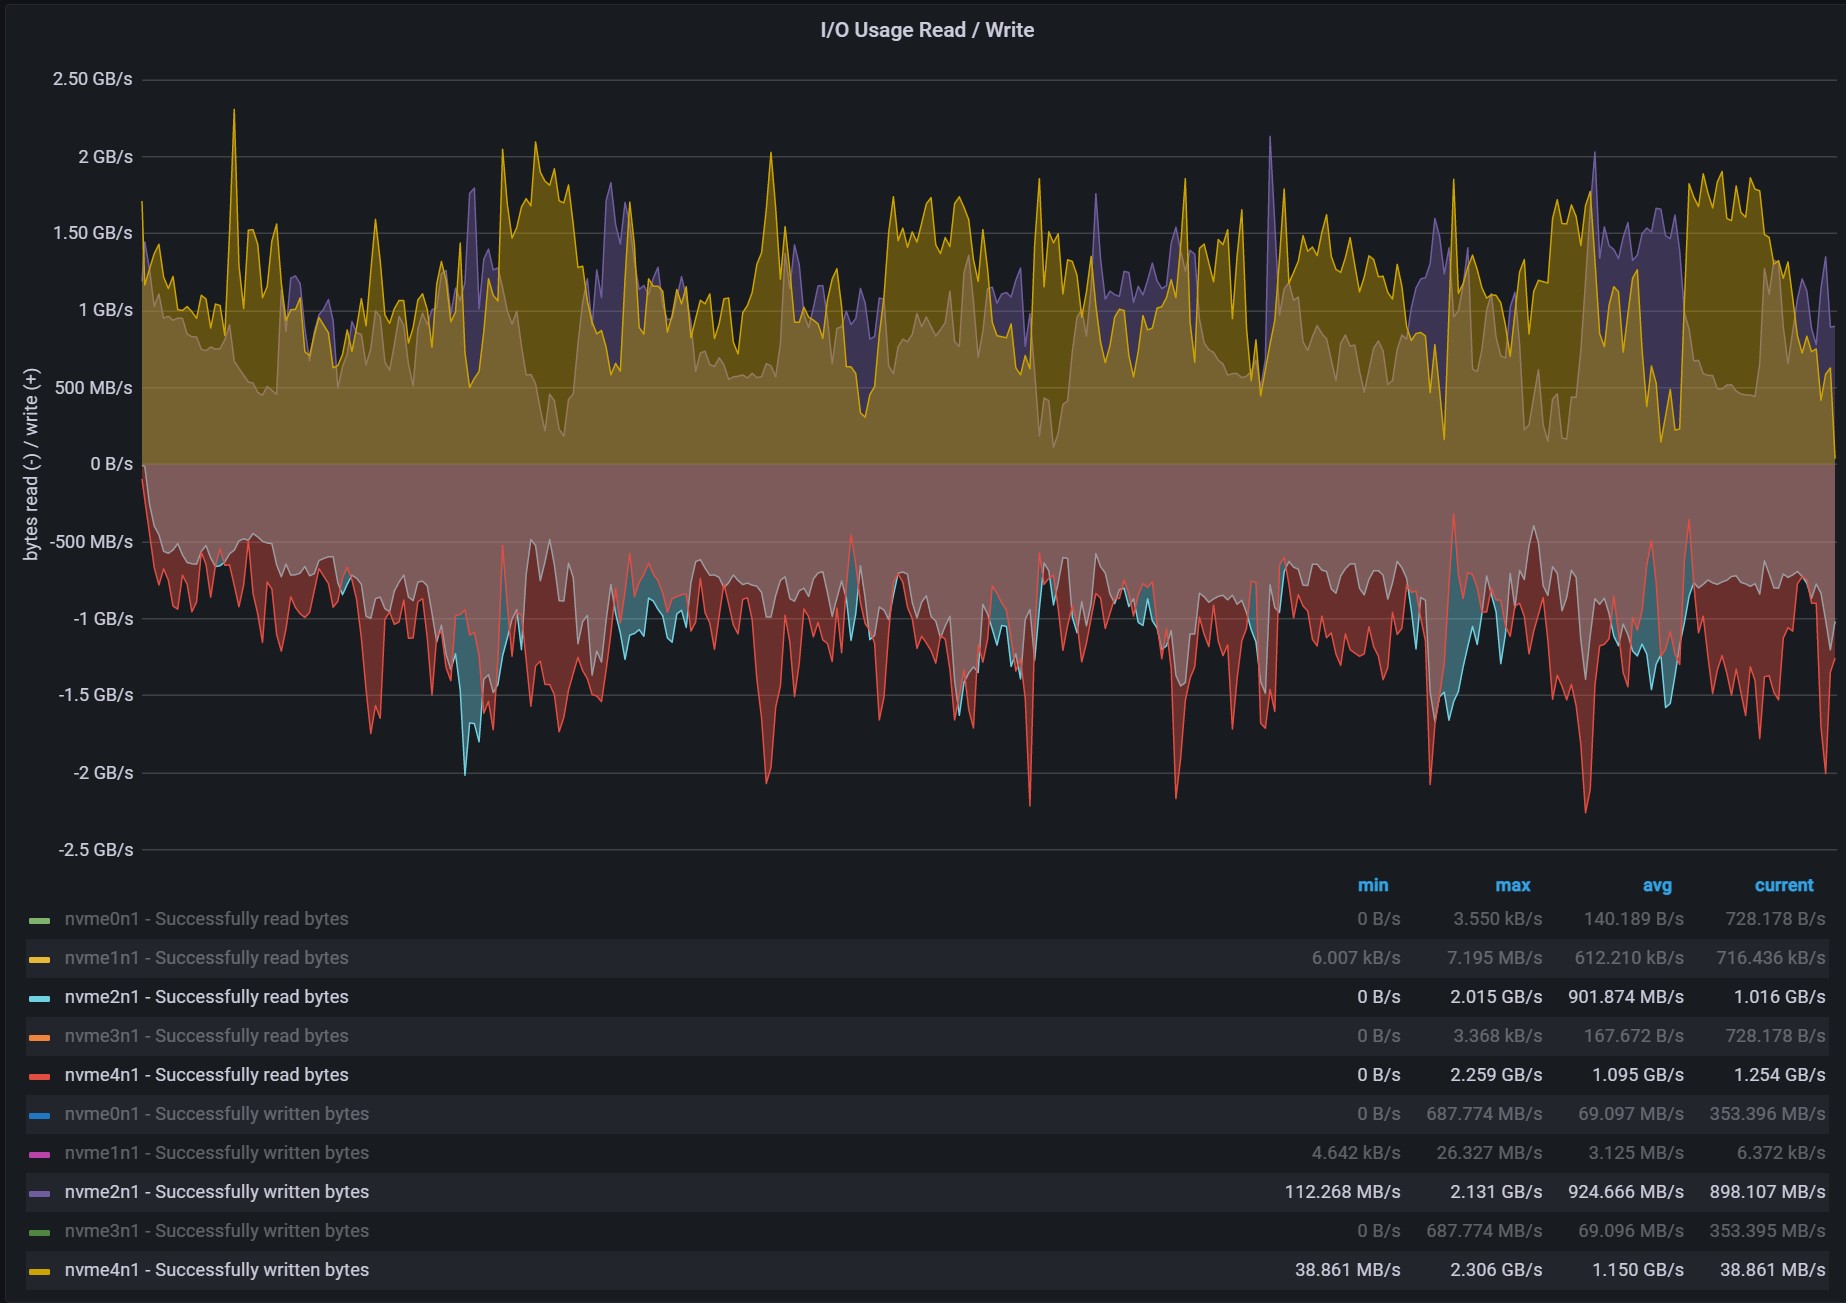
Disk bandwidth is looking great, each drive peaking a little over 2GB/s for read and write (which is very good considering this is a mixed read / write workload).
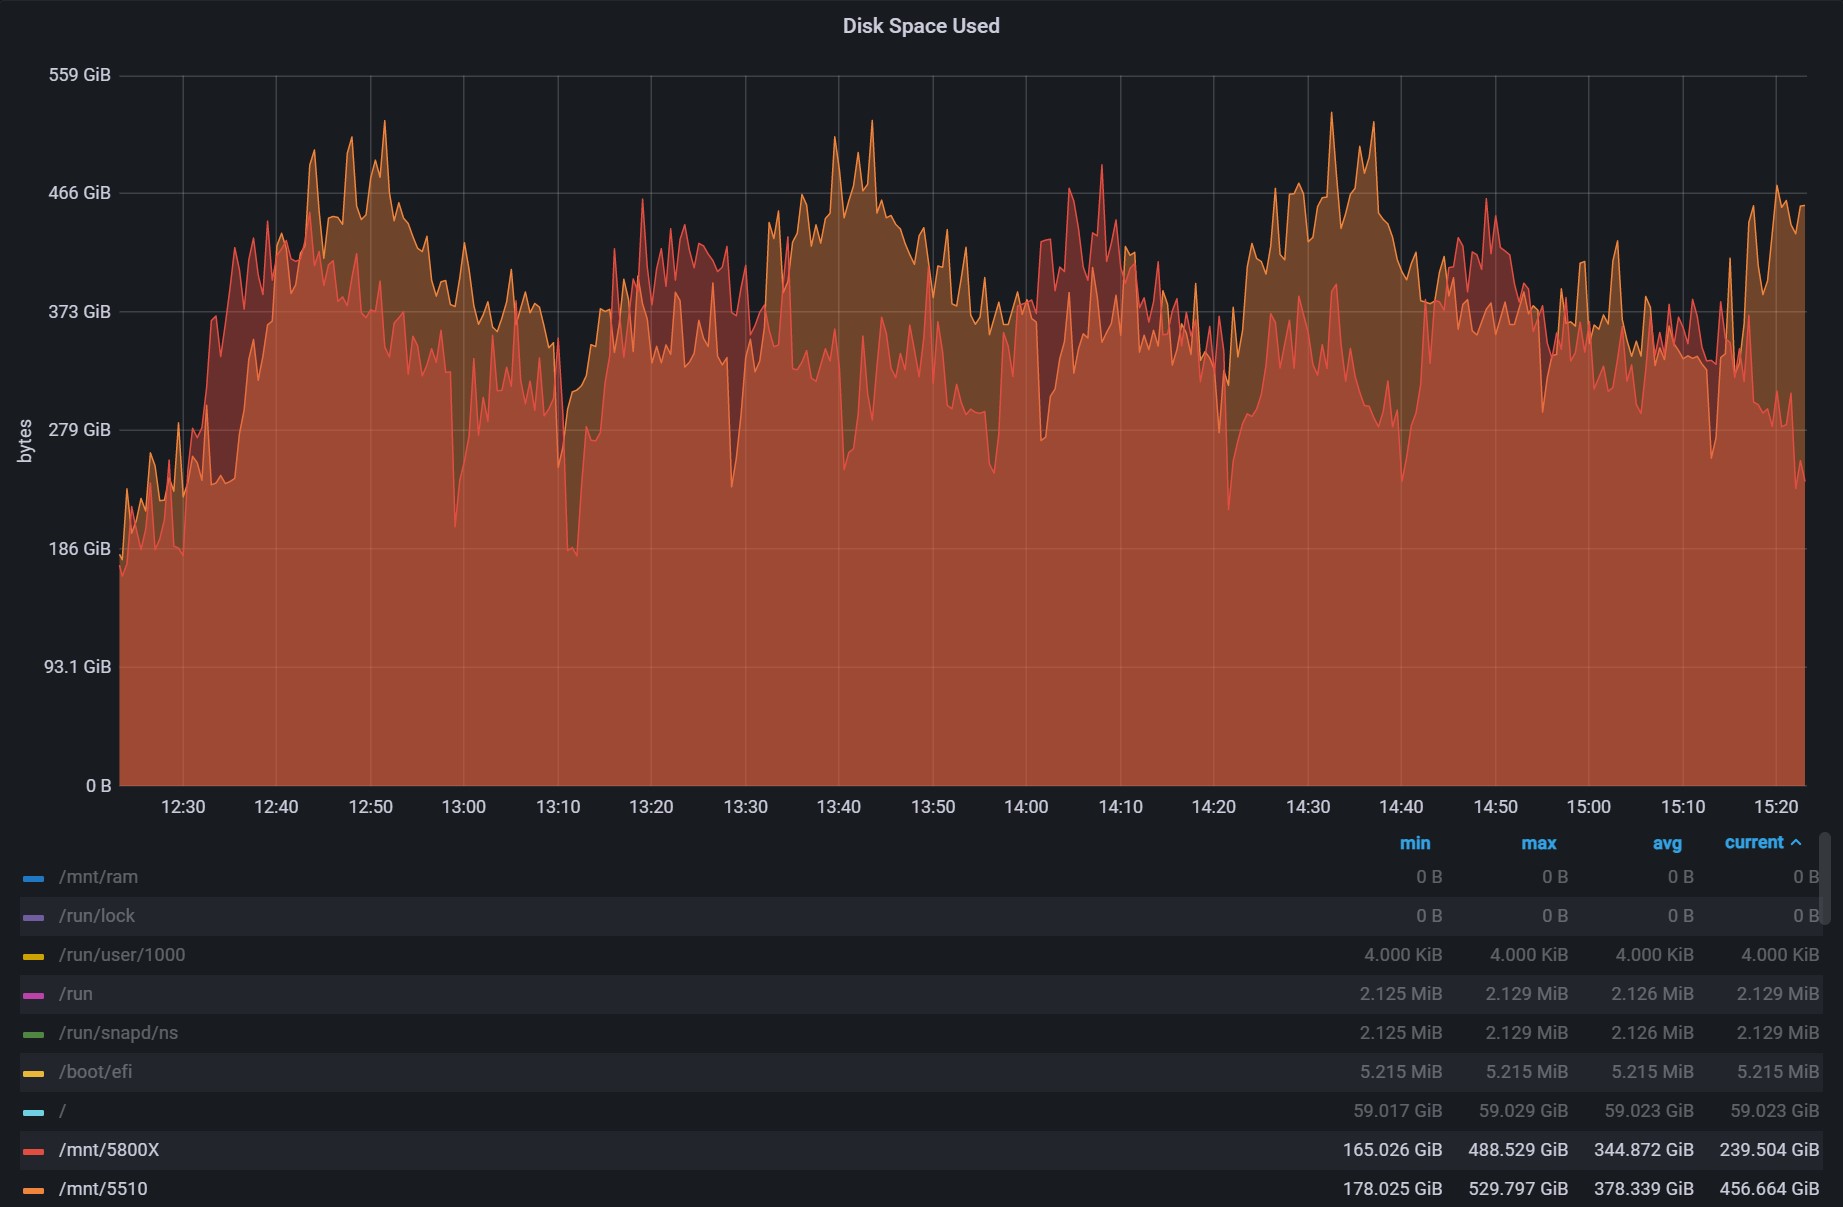
Disk utilization looks normal, although a little bit high. Still not quite sure why exactly the P5510 is seeing higher peak and average disk space used, they are both getting the exact same workload but it could be noise if I look over a longer period. This does, however, show that with 2 concurrent plots we did see a peak of almost 530GiB (265 per process).
Finally, we look at the output.
(venv) jm@beast:~$ cat chialogs/*.log | grep "Total"
Total plot creation time was 2139.78 sec (35.663 min)
Total plot creation time was 2608.75 sec (43.4791 min)
Total plot creation time was 2270.83 sec (37.8472 min)
Total plot creation time was 2804.23 sec (46.7371 min)
Total plot creation time was 2310.05 sec (38.5008 min)
Total plot creation time was 2737.6 sec (45.6266 min)
Total plot creation time was 2455.78 sec (40.9297 min)
Total plot creation time was 2769.5 sec (46.1583 min)
Total plot creation time was 2345.91 sec (39.0985 min)
Total plot creation time was 2487.4 sec (41.4566 min)
Total plot creation time was 2876.71 sec (47.9452 min)
Total plot creation time was 2737.29 sec (45.6216 min)
Total plot creation time was 2407.88 sec (40.1313 min)
Total plot creation time was 2364.36 sec (39.4059 min)

(venv) jm@beast:~$ grep -i "total plot creation time" /home/jm/chialogs/*.log |awk '{sum=sum+$6} {avg=sum/NR} {tday=86400/avg*4*101.366/1024} END {printf "%d K32 plots, avg %0.1f seconds, %0.2f TiB/day \n", NR, avg, tday}'
14 K32 plots, avg 2522.6 seconds, 13.56 TiB/day
That is it! 13.56TiB a day on the Threadripper. I was skeptical of an entry in the community spreadsheet that claimed the AMD 3970X could achieve 14TiB a day, but now I’m certain that it is achievable based on some of the additional testing.
Next step for beast…find him a new cage (aka replacing my damaged H510 case with a proper case with airflow)!


One Comment
Comments are closed.