
Chia Plotting Server Build – Dell R740xd with WD enterprise drives
It all starts with the plotman. As many of you know, Eric was the one that convinced me to build the original NUC. He messaged me the other day about a new server on eBay, asking me if I thought it was a good deal. I have worked with Dell over the years (they have used Intel SSDs for ages) but I’ve never actually owned a Dell server. Most of the plotting I’ve been doing on servers has been on the Intel Wolf Pass Server platform, specifically, the Intel® Server System R2208WFTZSR since it supports up to 4 U.2 NVMe direct connected to CPU through OcuLink cables directly from the motherboard on the combo hot-swap backplane (the U.2 backplane supports SAS, SATA, and PCIe with different cables).

Not that I need another server for any reason, but I panic bought it on eBay for $3000. Why? I have no need for any additional plotting power. So might as well have some fun and benchmark it while I do some plotting for a friend!
2x Intel® Xeon® Gold 6152 Processor
256GB DDR4, 4x 64GB 2666 LRDIMM
It came with a 16G Fibre Channel card, and 2x 25GB Mellanox NIC. I’m just using an Intel 10G NIC that I had lying around.
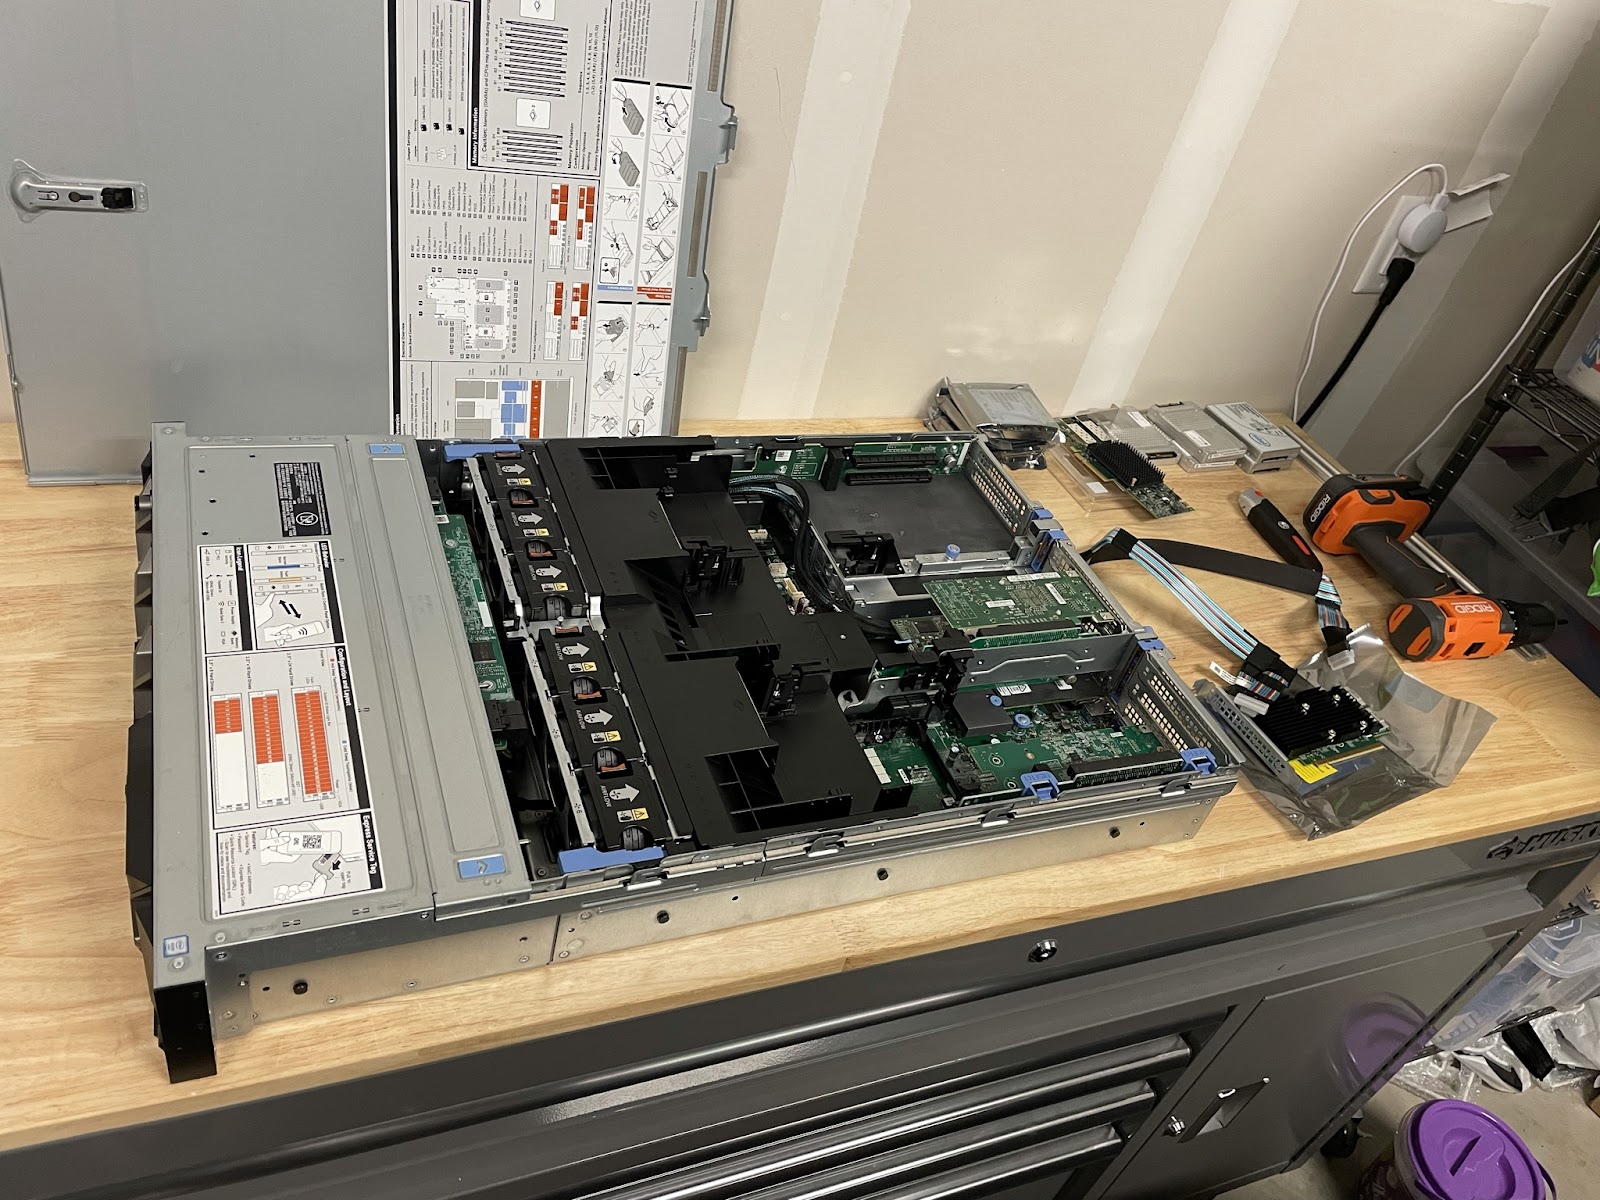
I had to purchase the add-on kit to attach the NVMe for $200, including the retimer card and the slim SAS cables to attach the NVMe. Thankfully mine came with the backplane that supports up to 12 NVMe SSDs.
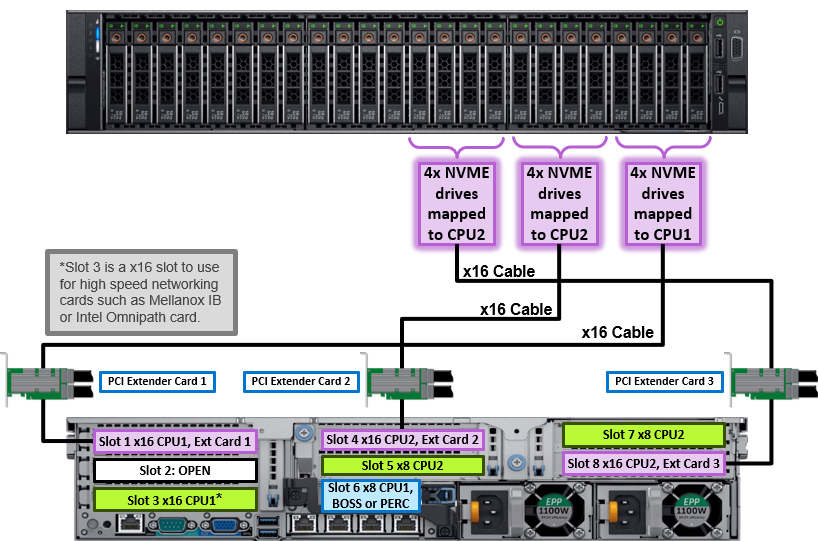
My friends at Storage Review did a great review of this server, showing a diagram of how this is connected below
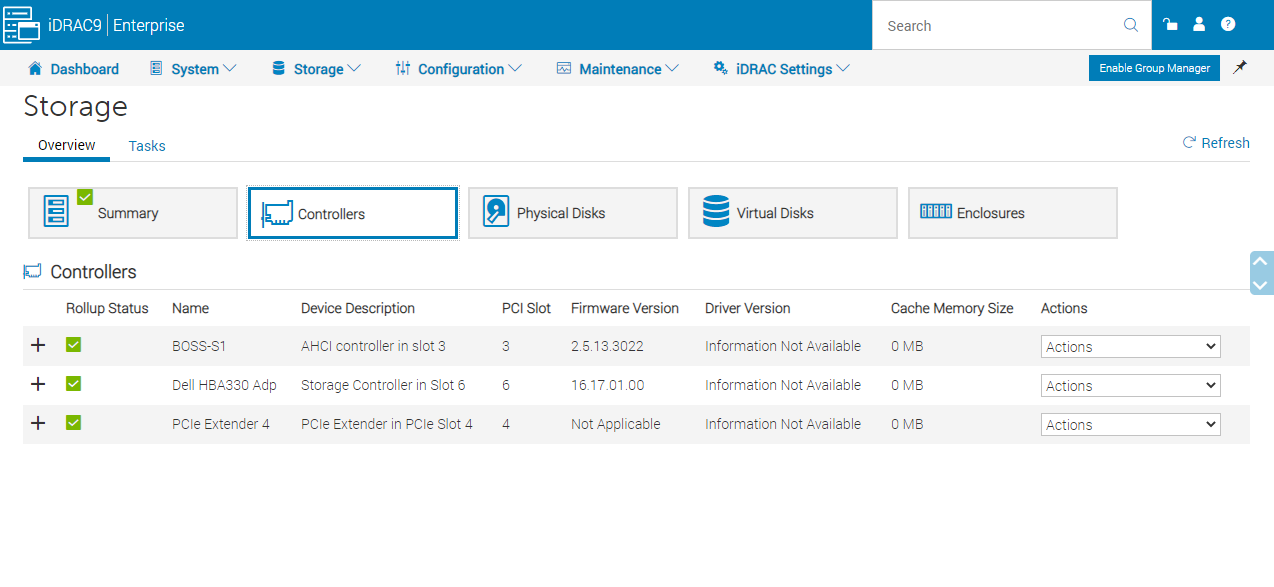
All I have to say is WOW about the iDRAC 9 management. I was able to log into the IP, remotely update the BIOS, the management code, all the device firmware, remotely mount my USB drive, install Ubuntu, and get up and running without having to leave Chrome.
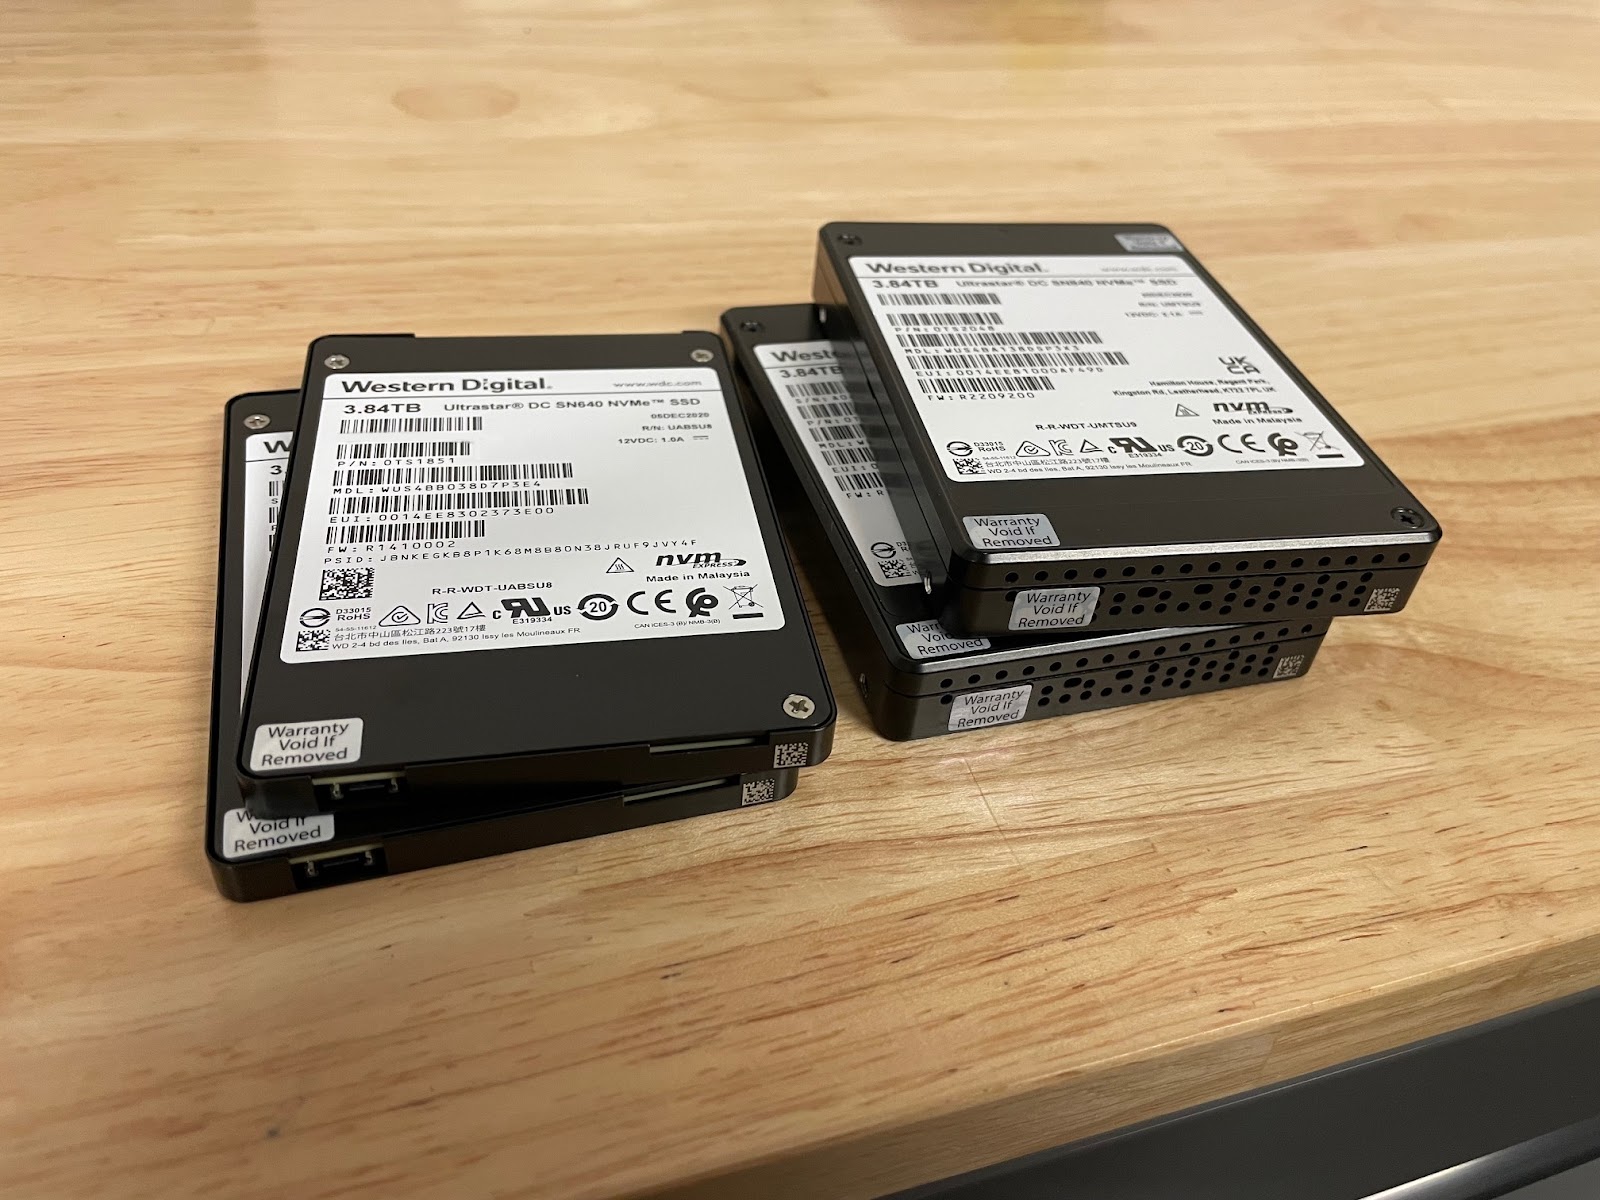
The plan was to start benchmarking this system with the Intel SSD D7-P5510, as many of you know which is my top plotting pick (unless you are lucky enough to find the Optane P5800X at a reasonable price). I’m actually going to start with the Western Digital Ultrastar DC SN640 and Ultrastar DC SN840 enterprise-class SSDs that they were gracious enough to send to me to benchmark (thanks guys!!). I don’t know much about Western Digital SSDs, so this will be fun to test over the next few weeks. They mentioned that they have a retail version of the DC SN640 called the WD Gold NVMe SSDs. An overview of Ultrastar drives and full specs can be found here as well.
I have input them into the endurance table.
Disclaimer!! SSD vendors publish endurance in TBW and DWPD based on the JEDEC JESD219 data center specification, it is not common practice to disclose NAND PE cycles or WAF. I have estimated both of those based on the TBW and DWPD (and my many years of designing SSDs)
| Vendor | Model | Form Factor | Interface | Class | User Capacity (GB): | usable GiB in OS | Raw Capacity (GiB) | Raw Capacity (GB) | Overprovisioning / Spare area | NAND P/E Cycles | Write Amplification Factor (WAF) | rated life in years | estimated NAND endurance (TBW, WAF=1) | Calculated Endurance (TBW) | Spec sheet rated TBW | DWPD over 5 years (calculated) | total amount plotted before wear out worse case (TiB) | total amount plotted before wear out best case (TiB) |
| WD | Ultrastar DC SN840 | U.2 15mm | NVMe | enterprise | 1600 | 1455 | 2048 | 2199 | 27% | 10000 | 2.5 | 5 | 21990 | 8796 | 8760 | 3 | 571 | 1429 |
| WD | Ultrastar DC SN840 | U.2 15mm | NVMe | enterprise | 3200 | 2911 | 4096 | 4398 | 27% | 10000 | 2.5 | 5 | 43980 | 17592 | 17520 | 3 | 1143 | 2857 |
| WD | Ultrastar DC SN840 | U.2 15mm | NVMe | enterprise | 6400 | 5822 | 8192 | 8796 | 27% | 10000 | 2.5 | 5 | 87961 | 35184 | 35040 | 3 | 2286 | 5714 |
| WD | Ultrastar DC SN640 | U.2 7mm | NVMe | data center | 960 | 873 | 1024 | 1100 | 13% | 7000 | 5.5 | 5 | 7697 | 1399 | 1401.6 | 0.8 | 91 | 500 |
| WD | Ultrastar DC SN640 | U.2 7mm | NVMe | data center | 1920 | 1747 | 2048 | 2199 | 13% | 7000 | 5.5 | 5 | 15393 | 2799 | 2803.2 | 0.8 | 182 | 1000 |
| WD | Ultrastar DC SN640 | U.2 7mm | NVMe | data center | 3840 | 3493 | 4096 | 4398 | 13% | 7000 | 5.5 | 5 | 30786 | 5598 | 5606.4 | 0.8 | 364 | 2000 |
Stupid me. I thought these blank drive covers were the 2.5in caddies. I will be ordering them on eBay for $5 each, but until then I’m doing the lazy way.

There we go, now at least they are hidden until my caddies arrive

Plotting config for first test run using plotman.
(venv) jm@r740xd:~/chialogs$ cat ~/.config/plotman/plotman.yaml
directories:
        log: /home/jm/chialogs
        tmp:
                - /mnt/ssd1
                - /mnt/ssd2
                - /mnt/ssd3
                - /mnt/ssd4
        dst:
                - /mnt/ssd0
scheduling:
        tmpdir_stagger_phase_major: 1
        tmpdir_stagger_phase_minor: 1
        tmpdir_stagger_phase_limit: 1
        tmpdir_max_jobs: 11
        global_max_jobs: 44
        global_stagger_m: 5
        polling_time_s: 20
plotting:
        k: 32
        e: False             # Use -e plotting option
        n_threads: 2         # Threads per job
        n_buckets: 128       # Number of buckets to split data into
        job_buffer: 3389     # Per job memory
SSD 1 & 2 are the SN840, SSD 3 & 4 are the SN640
(venv) jm@r740xd:~/chialogs$ sudo nvme list
Node             SN                   Model                                    Namespace Usage                      Format           FW Rev
---------------- -------------------- ---------------------------------------- --------- -------------------------- ---------------- --------

/dev/nvme1n1     A068XXXX             WUS4BA138DSP3X3                          1           3.20  TB /   3.20  TB    512   B +  0 B   R2210000
/dev/nvme2n1     A068XXXX             WUS4BA138DSP3X3                          1           3.20  TB /   3.20  TB    512   B +  0 B   R2210000
/dev/nvme3n1     A06AXXXX             WUS4BB038D7P3E4                          1           1.77  TB /   3.20  TB      4 KiB +  0 B   R1410002
/dev/nvme4n1     A06AXXXX             WUS4BB038D7P3E4                          1           1.58  TB /   3.20  TB      4 KiB +  0 B   R1410002
With default Ubuntu 20.04.2 settings, and no tuning I’m getting about 8TiB a day
(venv) jm@r740xd:~/chialogs$ grep -i "total time" /home/jm/chialogs/*.log |awk '{sum=sum+$4} {avg=sum/NR} {tday=86400/avg*44*101.366/1024} END {printf "%d K32 plots, avg %0.1f seconds, %0.2f TiB/day \n", NR, avg, tday}'
44 K32 plots, avg 47443.5 seconds, 7.93 TiB/day
Plotman has a very cool feature where we can analyze the times by temp drive, to see how we are doing!
(venv) jm@r740xd:~/chialogs$ plotman analyze --bytmp *.log
+-------------+----+-------------+--------------+--------------+---------------+--------------+--------------+
|    Slice    | n  |   %usort    |   phase 1    |   phase 2    |    phase 3    |   phase 4    |  total time  |
+=============+====+=============+==============+==============+===============+==============+==============+
| x-/mnt/ssd1 | 11 | μ=100.0 σ=0 | μ=17.6K σ=2K | μ=9.3K σ=390 | μ=17.2K σ=401 | μ=1.3K σ=91  | μ=45.4K σ=2K |
+-------------+----+-------------+--------------+--------------+---------------+--------------+--------------+
| x-/mnt/ssd2 | 11 | μ=100.0 σ=0 | μ=19.0K σ=2K | μ=9.0K σ=301 | μ=17.6K σ=392 | μ=1.3K σ=64  | μ=46.9K σ=2K |
+-------------+----+-------------+--------------+--------------+---------------+--------------+--------------+
| x-/mnt/ssd3 | 11 | μ=100.0 σ=0 | μ=19.6K σ=2K | μ=9.1K σ=303 | μ=18.2K σ=747 | μ=1.4K σ=93  | μ=48.3K σ=3K |
+-------------+----+-------------+--------------+--------------+---------------+--------------+--------------+
| x-/mnt/ssd4 | 11 | μ=100.0 σ=0 | μ=19.8K σ=2K | μ=9.3K σ=596 | μ=18.6K σ=639 | μ=1.5K σ=127 | μ=49.1K σ=2K |
+-------------+----+-------------+--------------+--------------+---------------+--------------+--------------+
The SN840 are slightly faster (no surprise as they are more expensive). I just got these drives yesterday and don’t know much about them, so I’ll be poking around in the next few weeks. I will find out exactly how fast they are when I throw them in a desktop that has a much faster per core CPU frequency. The Xeon Gold is reaching all core turbo up to 2800MHz with all 22 cores active, so I need to play with the settings a bit more. The per plot times aren’t anything special for anyone who is doing any desktop settings, but that isn’t what plotting on a server is about. Certainly you want to get the number as low as you can, but you want to have enough DRAM and SSD capacity to be able to at least cover all the physical cores (cores * 3400MB * 257GB SSD). Additional testing coming with RAID, drive-to-drive comparisons, iowait, and some really cool Linux tuning options we are working on!
Update 1 5/27/21
just for fun, I put one Optane P5800X and one Intel D7-P5510 and ran a SINGLE thread to each NVMe to show the comparison. This shows, with a single thread, we are very CPU bound in this case which is why they all look the same. If there is no iowait and the drives are all delivering the data fast enough to the CPU, a faster drive doesn’t help. The value of NVMe for plotting comes from the larger capacity drives being able to scale more processes before they start significantly slowing down. We start to scale the process on the SSDs we see how well the SSD architecture handles multiple plotting processes. Unfortunately, the P5800X I have is only 800GB so I can’t do a proper experiment, but I will be comparing this system with a few more sets of drives for fun to test.
(venv) jm@r740xd:~/chialogs$ plotman analyze --bytmp *.log
+---------------+---+--------+---------+---------+---------+---------+------------+
|     Slice     | n | %usort | phase 1 | phase 2 | phase 3 | phase 4 | total time |
+===============+===+========+=========+=========+=========+=========+============+
| x-/mnt/optane | 1 | 100    | 10.0K   | 4.1K    | 8.0K    | 544.400 | 22.6K      |
+---------------+---+--------+---------+---------+---------+---------+------------+
| x-/mnt/SN840  | 1 | 100    | 9.9K    | 4.1K    | 8.1K    | 528.600 | 22.6K      |
+---------------+---+--------+---------+---------+---------+---------+------------+
| x-/mnt/SN640  | 1 | 100    | 9.9K    | 4.1K    | 7.9K    | 516.100 | 22.4K      |
+---------------+---+--------+---------+---------+---------+---------+------------+
| x-/mnt/P5510  | 1 | 100    | 9.9K    | 4.1K    | 8.0K    | 519.100 | 22.4K      |
+---------------+---+--------+---------+---------+---------+---------+------------+


Hey JM Mate… Do a post on plotting using this with madMAx43v3r plotter! Seems to me Chia just had a big win against the “chia kills ssds” folks!
Oh, disappointing throughput for the money.