Chia Plotting SSD Buying Guide
Send feedback to @storage_jm on keybase. Photo Source: Intel and SNIA
“We have Amazon affiliate links in this article and we earn commission from qualifying purchases at $0 cost to you. We only recommend products that we use ourselves and would never compromise the integrity of your build. This helps us bring you quality content and keep this site running.”
Summary
Used enterprise and data center SSDs are recommended for plotting to due the higher capacity, higher performance, sustained bandwidth, and high endurance ratings required for plotting a large amount of data. You can look at what the community is using in the reference hardware wiki, as well as a list of data center SSDs in the SSD endurance wiki
Top performance plotting drive, PCIe 4.0 NVMe. Most of these are brand new and harder to find but the fastest drives possible for plotting
- U.2: Intel SSD D7-P5510, Samsung PM1735, PM9A3, or Kioxia CM6 or CD6
- M.2 110mm: PM9A3, Kioxia XD6
Top mainstream pick
- U.2: Intel SSD DC P4510 or P4610, Samsung PM983 Samsung PM1725a, Micron 9300, Kioxia (formerly Toshiba Memory) CM5
- M.2 110mm: Samsung PM983
- PCIe 3.0 x8 AIC: P4608, P4618
Top value pick (older drive models 3-5 years)
- U.2, PCIe AIC: Intel SSD DC P3700, Intel SSD DC P3600, P3608
- M.2: Kioxia XD5, LiteOn EPX, Samsung PM963
Top SATA SSDs
- Old Intel (S3700, S3710, S3610), new Intel (S4510,S4610), Micron 5300, Samsung PM/SM883, 863
The plotting process requires temporary (ephemeral) storage capacity for use of creating the plots. Because the process goes through sorting and algorithm compression, more capacity is required than the final plot size.
| K-value | DRAM (MiB) | Temp Space (GiB) | Temp Space (GB) |
| 32 | 3389 | 239 | 256.6 |
| 33 | 7400 | 512 | 550 |
| 34 | 14800 | 1041 | 1118 |
| 35 | 29600 | 2175 | 2335 |
The plotting process uses this temporary storage to move files in and out of DRAM for the phases of the plotting process, and high performance disk storage will result in lower plot times.
Capacity
Figure out the target amount of parallel plots you want to create and divide it by the total amount of temp space required per plot. In general, SATA SSDs start to slow down after 2 plotting processes due to the limitation on the bandwidth on the bus (more info below), so aim for 480-960GB SATA SSDs. NVMe SSDs can sustain more plots in parallel, and enterprise TLC drives are commonly found in 1.92, 3.84, and 7.68TB capacity points for read-intensive / mainstream, and 1.6, 3.2, and 6.4TB for mixed-use. You can look at the use of plotman, a community tool for automating the plotting process by the venerable @ericaltendorf on keybase, or manually staggering to get better capacity utilization. The process does not require the full temporary storage space for the full duration of the plot creation. Beware though…if you run out of space on a drive, you have to manually delete the temp files associated with one of the plots, stop all the processes, and start over.
Here are the capacity of different classes of SSDs. Use the math above in GB with the label capacity of the SSD to figure out how many plotting processes your SSD can support. Math is
(number of SSDs) x (capacity of SSD in GB) / temp space per K=32 = total amount of parallel processes| SSD Type | Capacities |
| Consumer | 500GB, 1TB, 2TB, 4TB |
| Data Center NVMe – hyperscale | 960, 1920, 3840GB |
| Enterprise SATA recent | 480, 960GB, 1.92, 3.84, 7.68TB |
| Old enterprise (2014-2016) | 200, 400, 800, 1600GB |
| Old Intel (2014-2017) | 1TB, 2TB, 4TB, 8TB |
| Enterprise NVMe read-intensive (1 DWPD) | 960GB, 1.92, 3.84, 7.68TB |
| Enterprise NVMe mixed use (3 DPWD) | 800GB, 1.6, 3.2, 6.4, 12.8TB |
RAID
A very performant way to plot is to RAID 0 multiple small SSDs together. RAID 0, called striping, does not provide any data integrity – the main purpose is to increase array capacity and performance. This has the advantage of getting better capacity utilization vs single drive (e.g. on a 480GB drive, only 356GB are used and the rest is not being utilized). The processes also don’t all write at the same time, so RAID helps distribute the IO over many drives and improve performance. Small capacity datacenter SATA SSDs (400, 480GB) is an easy way to attach drives (cheap SATA cables) since almost every desktop motherboard supports 4-6 SATA ports. Software RAID like mdadm has very good efficiency, with Intel posting scaling numbers with NVMe RAID with near linear scaling. If you are new to mdadm, Intel VROC guide (which uses mdadm RAID in Linux) has some basic commands.
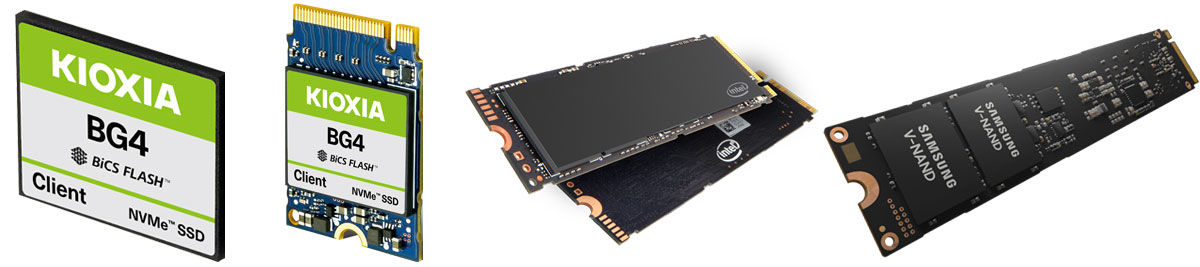
Consumer SSDs
Consumer NVMe SSDs are optimized for low power, low cost, and performance in mainstream desktop applications (like gaming, content creation, work). Today they are almost exclusively in the M.2 80mm form factor for compatibility with desktops and laptops with the same devices. There are higher end enthusiast client NVMe SSDs that are faster and optimized for better performance. The consumer NVMe market was over 100 million units shipped in 2020, so NVMe SSDs come from many different vendors, products, and firmware. Consumer drives generally employ some sort of SLC caching to improve performance on small capacity SSDs, and NAND die have gotten larger over time this is beneficial for cost but results in fewer dice per SSD and lower parallelism. Consumer NVMe SSDs also generally have low amount of spare area or overprovisioning, and perform poorly when they get close to being full.
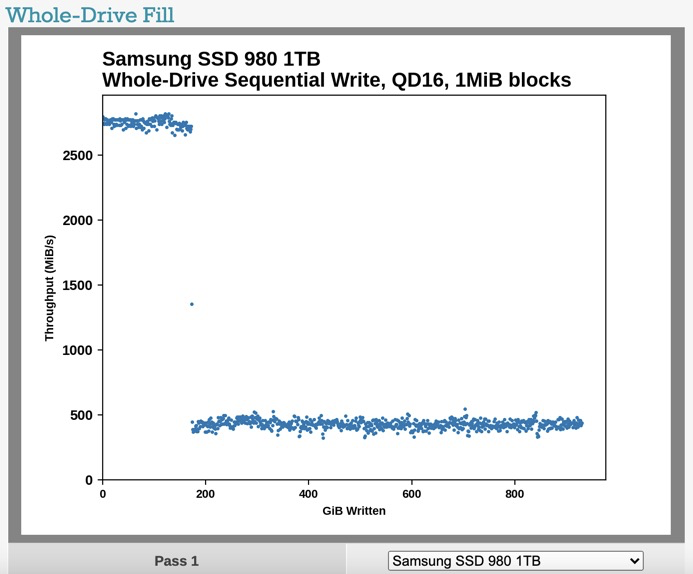
Source: https://www.anandtech.com/show/16504/the-samsung-ssd-980-500gb-1tb-review/4
Performance drops significantly when the drive gets full. SSD performance is very nuanced, since the performance of an SSD varies greatly by workload. A workload can vary in block size (or called transfer size) and queue depth (the number of outstanding commands), amount of data being transferred and of course a mix of reads/writes. Performance is measured in IOPS (Input / Output Operations Per Second, which multiplied by block size yields bandwidth), latency, quality of service (QoS, or latency over time), and much more (things like stability and variance). The even more confusing thing is that SSD performance varies depending on how full the drive is as a function of “spare area” for garbage collection in the SSD and various different caching algorithms. Many sophisticated engineers are employed full time at tech companies to measure performance, and unfortunately really accurate performance of a device can’t usually be measured in a short amount of time. Consumer SSDs are measured when the drive is empty, data center and enterprise SSDs are measured when the drive is full (worst case).
Besides the performance, form factor, and power limitations of consumer NVMe SSDs compared to data center SSDs, they have a significantly lower amount of NAND endurance because, in general, consumers don’t need very much.
Data Center vs Enterprise
Many people use these interchangeably, but some SSD vendors have a “data center” class NVMe SSD that is sold to hyperscale data centers like Facebook and Microsoft. SNIA has a handy chart that shows the differences, but generally there are differences in price, endurance, form factor, and features. Enterprise SSDs are used by storage companies like Dell EMC, HPE, Oracle, Lenovo, etc. These generally come in read intensive (1 DWPD endurance) and mixed use (3 DWPD endurance), the latter being suitable for write intensive workloads like caching and database (or…PLOTTING!!). Data center SSDs are designed to be in different form factors (covered below) that enable higher performance and power vs consumer M.2 SSDs, are designed for 100% duty cycle (all day everyday) workloads, and even the lowest endurance data center drives are 3-5x higher than consumer SSDs. Enterprise SSDs also have a very low failure rate, which is why they are easily found on eBay after the 5 year warranty, many are designed to last much longer than that because they have no moving parts (like HDDs). You can find data center SSD reviews at ServeTheHome, Storage Review, etc.
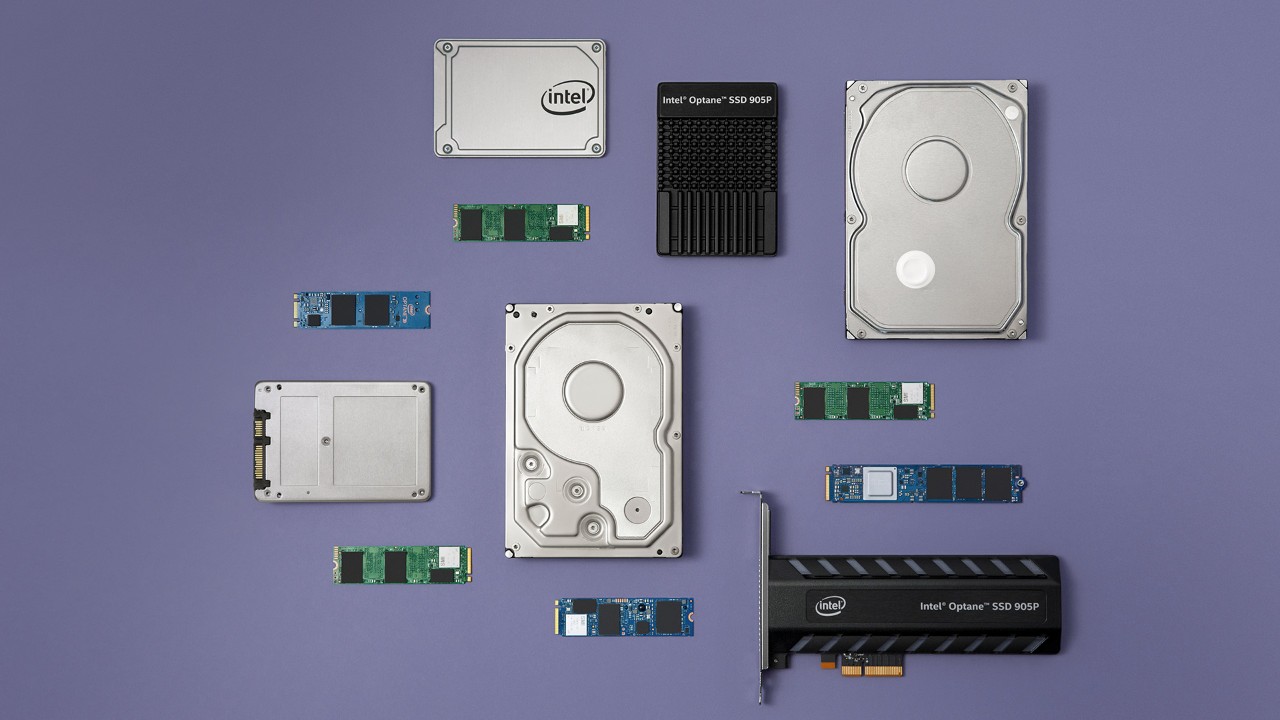
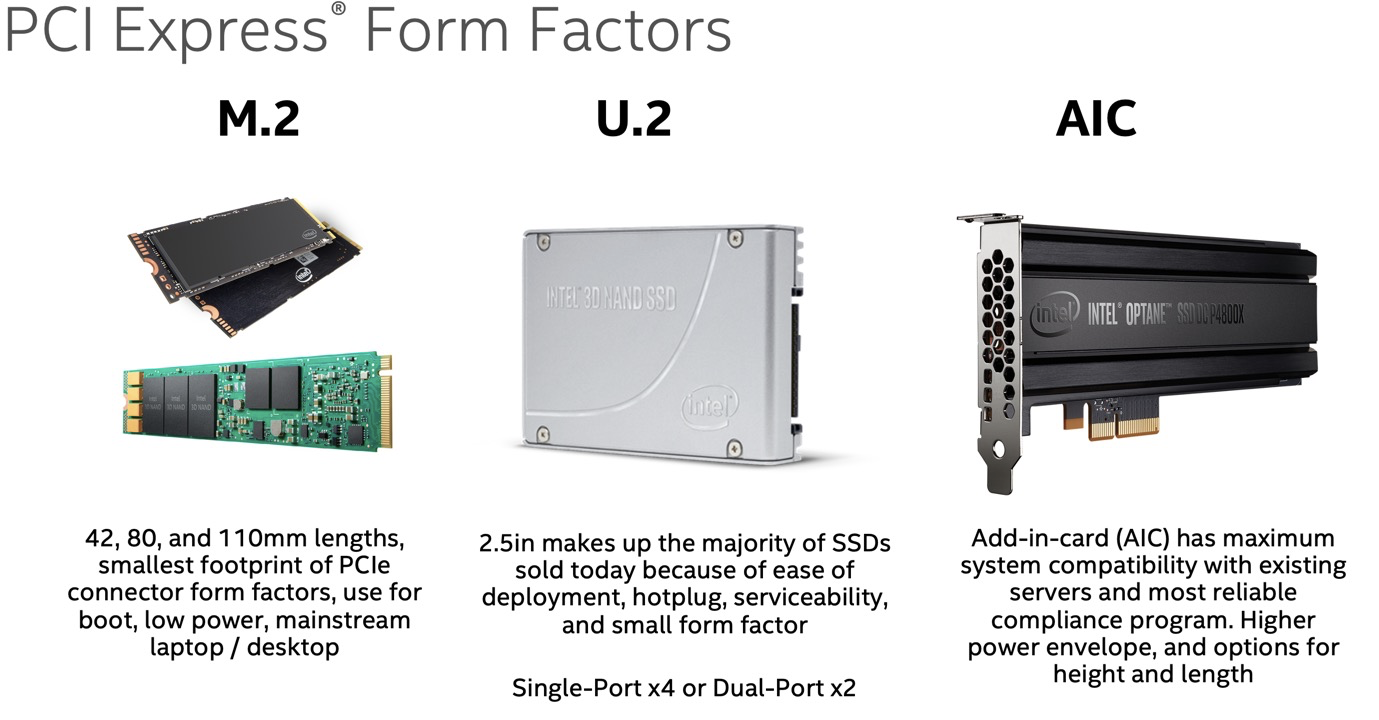
Form Factor dictates the max performance
NVMe SSDs come in all shapes, sizes, power, and performance since the protocol is scalable. You have form factors that dictate the physical characteristics – capacity of SSD, physical size of the board, number of NAND packages, size of controller, and power that really dictate the max performance. This means you have small form factor BGA for mobile systems, M.2 for notebook and desktop, U.2 for enterprise servers, and AIC (add-in-card) for standard PCIe slots. There are emerging new standards for data center like EDSFF, that build off the Intel “ruler” form factor. In the mobile laptop and desktops M.2 is the mainstream form factor. You can learn more about SSD form factors at SNIA. More power = higher performance = higher thermals. Note…if you put a U.2 NVMe in a desktop (actually this goes for any SSD) make sure it has proper airflow. U.2 is the most common enterprise SSD form factor, but M.2 110mm was also very popular in a few hyperscale cloud providers like Facebook and Microsoft. I recommend data center U.2 NVMe SSDs for plotting, but there are plenty of good options in M.2 110mm and AIC as well.
Lots of people are using M.2 carrier cards that house multiple M.2s. These mostly require PCIe bifurcation support of x16 to x4x4x4x4 in the BIOS, unless they contain a PCIe switch.
Using U.2 on a desktop requires a custom adapter (unless you have an X299 board or server board that supports native U.2 NVMe SSDs. You can use an adapter like the ones below.
- PCIe add-in-card to U.2 adapter, StarTech PEX4SFF8639
- DiLinKer M.2 to U.2 I’ve used this on dozens of desktops and drives with no issues at PCIe 3.0 x4 (not tested yet at PCIe 4.0 x4)
- If you are on a Supermicro or server platform, you can use retimer cards like this with OcuLink cables (this is the official name for the PCIe compliant cable, although PCIe runs on many, many different types of cabling)
- If you want to attach 4-8 U.2 on a single desktop, you can use a card like this that contains a PCIe switch (no need for BIOS settings!)
Endurance
SSDs have finite endurance, or the amount of data you can write to the SSD before the device wears out and can no longer store data safely. The SSD industry uses the term endurance, but it is also referred to as SSD life or SSD wear out. SSD vendors generally specify this in two ways, TBW (terabytes written) or DWPD (drive writes per day) which is supposed to be an easy metric of how much you can write to the device every day of the warranty period. SSD endurance will vary greatly from what the SSD vendor specifies due to the dependency on the workload (random write vs sequential write, large block size vs small) and as a function of free space or “overprovisioning” on the SSD. Mainstream SSD firmware use unwritten LBAs as spare area for garbage collection until written to, and can mark used LBAs free again with a “TRIM” command. The most important thing is that endurance can be accurately measured and estimated with a few simple equations. Datacenter drives often have petabytes written before they wear out, whereas consumer drives have only a few hundred TBW (terabytes written) before they wear out. See the details in the SSD endurance wiki where we actually calculate the expected number of plots many different drive models can make before wearing out, and the best value for endurance. Intel drives can be modeled at http://intel.com/endurance. The plotting process requires 1.6-1.8TiB of disk writes per k=32!!! This is an insane amount of data being written and will obliterate consumer NVMe drives with low TBW ratings.
MLC vs TLC vs QLC NAND
MLC > TLC > QLC in performance (program and erase times), and endurance (amount of data you can write to the device before wearing out). Data center SSDs have moved exclusively to TLC due to the great SSD performance and sufficient endurance (often up to 3 drive writes per day and 10,000 NAND program / erase cycles). This makes the argument that MLC is really not required anymore. Consumers want lower cost SSDs thus QLC was brought into the market. It performs significantly worse than TLC at the moment due to much longer program times and lower endurance, but don’t count out the industry to improve the performance as they did with TLC. Endurance is really not an issue for consumer use, even with QLC devices just due to the nature of how much data a standard consumer writes on their devices per day. Performance can also be masked by fancy algorithms, caching, and dynamic SLC modes. As a general rule, these methods work well for mainstream and entry devices but do not fly in data center, enterprise, and demanding creator/workstation use cases. You may still find MLC drives if you are buying 5-6 year old used data center SSDs (e.g. P3700). QLC is great for capacity optimized drives and are widely used in cloud object storage, AI, etc…however, they are not the right fit for plotting due to the tradeoff of write performance and endurance (which are both required for plotting)
Storage Interface
Data center SSDs come in SAS, SATA and NVMe (PCIe). SATA and SAS share the same physical bus and form factor as 2.5in HDDs, and the protocols have been around for a few decades. SATA 6Gbps was released in 2008-2009, and is the final version of the interface speed at ~560MB/s after the interface overheads. SAS has now expanded to 12 and 24Gbps, although the latter is brand new and is not widely in deployment. SAS is meant for large storage subsystems where there are many devices to hosts, dual port and high availability, and enterprise features. SAS is generally much more expensive than SATA and even NVMe (Source: Forward Insights SSD Report Q1’21). The NVM Express spec (NVMe) is the standard for PCIe SSDs. NVM Express, Inc. the company is a consortium of large tech companies. NVMe contains the host to device protocol for all the commands an operating system would need to communicate with an SSD: read, write, flush, TRIM, management of firmware, temperature, errors, and many more features. It also contains the command structure and the queuing mechanism, which is referred to as the host control interface. NVMe was designed from the ground up for SSDs, so it is much more efficient, lower latency, and scalable vs legacy interfaces like SATA. NVMe SSDs using PCIe 4.0 x4 are up to 13 times faster than a SATA SSD in max bandwidth and IOPS. Last year I recorded a webcast on SAS vs NVMe representing team NVMe.
Bandwidth
Bandwidth is the measurement of the amount of data being transferred per second. Bandwidth is interface dependent due to the electrical protocols. Extra bandwidth on the PCIe bus only buys an SSD extra performance if it is the current bottleneck. If you have a bottleneck at low capacity (not enough NAND for enough parallelization) or at power (throttling the NAND die due to a form factor power limitation) then adding more interface bandwidth won’t matter. A well-designed SSD while try to bump right up to the interface bottleneck on bandwidth.
Scalable for PCIe 4.0 and PCIe 5.0
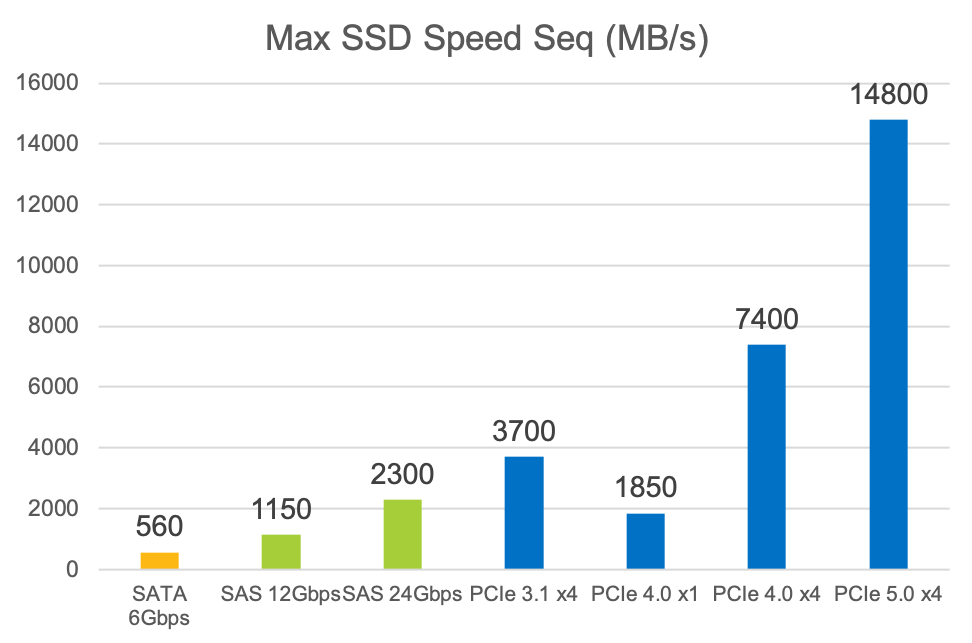
The PCIe specs are owned by PCI-SIG, completely separate from NVM Express. There are no changes needed to the NVMe spec to support the higher throughput of PCIe 4.0 (16GT/s which is roughly ~2GB/s per lane) and in the future PCIe 5.0 speeds (32GT/s). The majority of NVMe SSDs use 4 lanes of PCIe. PCIe has inherently scalable performance by adding lanes. Devices like GPUs that need max bandwidth can use PCIe x16 to add more lanes and more bandwidth. Current PCIe 3.0 NVMe SSDs are up to 7x the performance of a SATA SSD and PCIe 4.0 NVMe SSDs will be 14x.
| Interface and links | Spec | Transfer Rate | Approx Max SSD Speed (MB/s) |
| SATA 6Gbps | SATA 3.0 | 6Gbps | 560 |
| SAS 12Gbps | SAS 3.0 | 12Gbps | 1150 |
| SAS x2 12GBps | SAS 3.0 | 12Gbps | 2300 |
| SAS 24Gbps | SAS 4.0 | 24Gbps | 2300 |
| PCIe 3.1 x4 | PCIe 3.1 | 8GT/s | 3700 |
| PCIe 3.1 x8 | PCIe 3.1 | 8GT/s | 7400 |
| PCIe 4.0 x4 | PCIe 4.0 | 16GT/s | 7400 |
| PCIe 4.0 x8 | PCIe 4.0 | 16GT/s | 14800 |
| PCIe 5.0 x4 | PCIe 5.0 | 32GT/s | 14800 |
Updating firmware
Data center SSDs often have maintenance release firmware 1-2 years after the initial launch that improve compatibility, firmware stability, features, security and bug fixes. See your vendor’s website to look for firmware updates when you buy a used data center SSD. On Intel SSDs the tool is called IntelMAS and contains the binaries built in for the latest firmware.
Filesystems
Ext4 is the default in Linux, but filesystems like XFS, F2FS, and btrfs have advantages based on the application. In this benchmark XFS came out on top. Beware, if you just do mkfs.xfs you it will reserve some capacity for the file checksums. You can disable this by doing crc=0. If you didn’t have ECC RAM I suppose enabling the checksum may be a good idea, as the Chia team did report some corrupt plot files they suspected were from non-ECC memory bit flips.
sudo mkfs.xfs -m crc=0 -f -L $DiskLabel $DevNameZFS and BTRFS are great for durable storage, with features like copy on write, checksums, compression, snapshots and data integrity, but are not required for ephemeral / temp storage applications. For plotting you just want the filesystem that produces the plots the fastest.
Enabling TRIM
The purpose of TRIM is to improve efficiency in SSD garbage collection, effectively improving performance over time and improving endurance. Deallocate in NVMe (this is what it is called in the spec) marks LBAs as not in use so the SSD can claim the space back to use. TRIM is important for keeping WAF down because the host has to tell the SSD which data is not in use. TRIM gets sent during a format or sanitize operation, during filesystem creation (quick format in Windows, discard in Linux), and during filesystem deletes. TRIM is the communication between the host software and SSD to show which data is needed, and tell the SSD when it is not needed anymore so that it can reclaim the space. Remember, the SSD has no way of telling the host which LBAs are free and which ones are used, this is the filesystem’s job. TRIM is a one way street between the host telling the SSD that certain LBAs now do not contain valid user data. Certain SSD models tell you how much data on the SSD is free vs used in NVMe Namespace Utilization field (in the identify namespace command, sudo nvme id-ns /dev/nvme0n1
Most common filesystems in Linux disable discard on mount in favor of doing a scheduled fstrim task, which sends TRIM commands to all unused space in the file system on a daily or weekly basis. Enabling discard will improve endurance and performance by sending TRIM immediately when files are deleted, but may decrease performance, latency and quality of service due to blocking IO commands. This will vary greatly between drive model, interface, and firmware handling, as newer drives generally handle this type of workload much better.
Example fstab
/dev/disk/by-uuid/youruuidhere /mnt/ssd xfs discard,defaults 0 0Mount your SSDs with option discard to keep it running smooth, improve endurance, and increase performance. The plotting process is not latency sensitive so enabling TRIM by mounting the drive with discard is the easiest solution.
You can manually TRIM all free space on all SSDs by running sudo fstrim -A


2 Comments
Comments are closed.